
Seller's Agent in 2017
Betsy Russell
Zarco Properties, LLC
(281) 364-1588
89 Total Sales

Estimated Value: $249,909 - $270,000
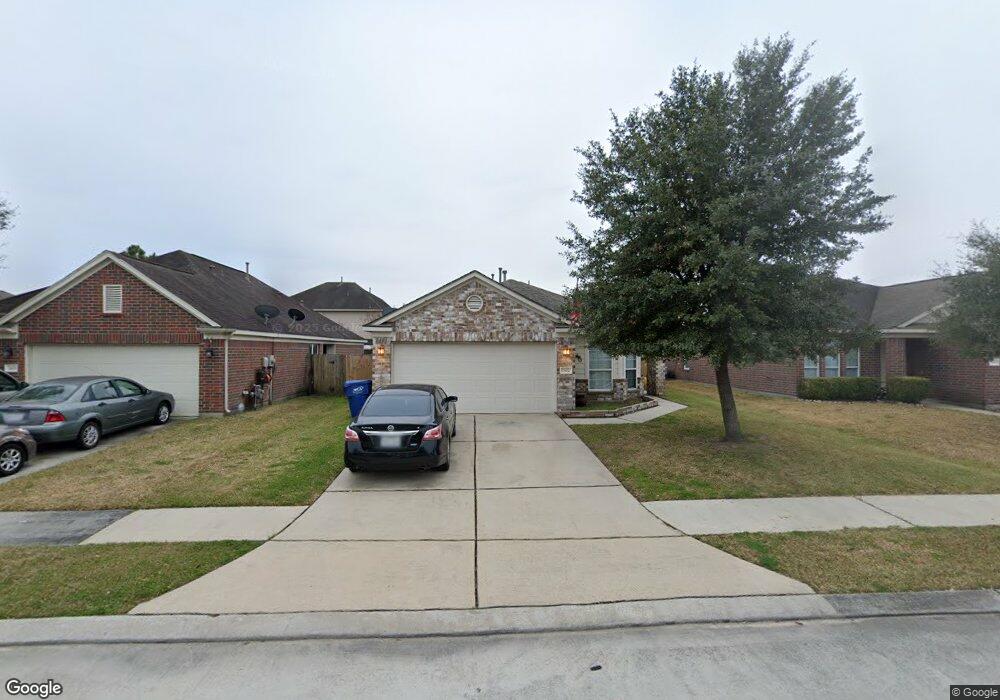
This home will be available for showings for the first time on Sunday, Oct 22. Located in the nice newer neighborhood of Forest Village, this house is one of Lake Ridge Builder's most popular floor-plans. Four bedrooms. New roof and flooring in 2016. No carpet in the house. Energy efficient. Highly-rated CISD schools. Low HOA. Just minutes from shopping and dining. Great access to I45, The Hardy Toll Rd, and the Grand Parkway will make your daily commute a piece of cake!
Last Agent to Sell the Property
Zarco Properties, LLC License #0614334 Listed on: 10/16/2017
| Date | Buyer | Sale Price | Title Company |
|---|---|---|---|
| Yutzy David B | -- | Capital Title | |
| Edmunds Becky L | -- | American Title Company | |
| Edmunds Becky L | -- | -- |
| Date | Status | Borrower | Loan Amount |
|---|---|---|---|
| Open | Yutzy David B | $168,546 | |
| Previous Owner | Edmunds Becky L | $124,761 |
| Date | Event | Price | List to Sale | Price per Sq Ft |
|---|---|---|---|---|
| 12/30/2021 12/30/21 | Off Market | -- | -- | -- |
| 12/07/2017 12/07/17 | Sold | -- | -- | -- |
| 11/07/2017 11/07/17 | Pending | -- | -- | -- |
| 10/12/2017 10/12/17 | For Sale | $170,000 | -- | $95 / Sq Ft |
| Year | Tax Paid | Tax Assessment Tax Assessment Total Assessment is a certain percentage of the fair market value that is determined by local assessors to be the total taxable value of land and additions on the property. | Land | Improvement |
|---|---|---|---|---|
| 2025 | $2,628 | $247,616 | $42,500 | $205,116 |
| 2024 | $3,847 | $242,396 | -- | -- |
| 2023 | $3,847 | $220,360 | $42,500 | $229,030 |
| 2022 | $5,299 | $200,330 | $42,500 | $197,440 |
| 2021 | $5,133 | $182,120 | $42,500 | $139,620 |
| 2020 | $5,120 | $173,910 | $23,820 | $150,090 |
| 2019 | $4,851 | $160,940 | $23,820 | $137,120 |
| 2018 | $4,449 | $147,590 | $23,820 | $123,770 |
| 2017 | $4,445 | $147,590 | $23,820 | $123,770 |
| 2016 | $4,434 | $147,240 | $23,820 | $126,350 |
| 2015 | $3,485 | $133,850 | $23,820 | $118,920 |
| 2014 | $3,485 | $121,680 | $23,820 | $97,860 |
Seller's Agent in 2017
Betsy Russell
Zarco Properties, LLC
(281) 364-1588
89 Total Sales
J
Buyer's Agent in 2017
Juanita Martin
Texas Premier Realty
(713) 489-9897
Source: Houston Association of REALTORS®
MLS Number: 95359596
APN: 5159-02-09000
Disclaimer: Certain information contained herein is derived from information provided by parties other than Homes.com. All information provided is deemed reliable, but is not guaranteed to be accurate and should be independently verified.
![]() Copyright 2026, Houston REALTORS® Information Service, Inc.
Copyright 2026, Houston REALTORS® Information Service, Inc.
The information provided is exclusively for consumers’ personal, non-commercial use, and may not be used for any purpose other than to identify prospective properties consumers may be interested in purchasing.
Information is deemed reliable but not guaranteed.
Ask me questions while you tour the home.