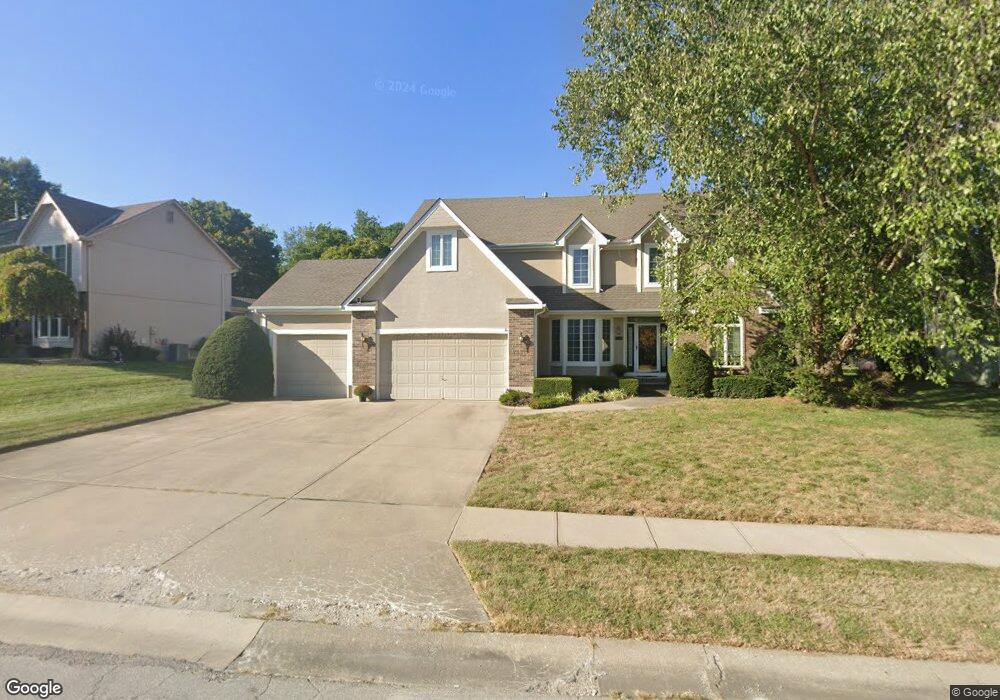
2422 SE 5th Terrace Lees Summit, MO 64063
Estimated Value: $445,000 - $509,000
4
Beds
3
Baths
3,508
Sq Ft
$137/Sq Ft
Est. Value
About This Home
This home is located at 2422 SE 5th Terrace, Lees Summit, MO 64063 and is currently estimated at $479,563, approximately $136 per square foot. 2422 SE 5th Terrace is a home located in Jackson County with nearby schools including Highland Park Elementary School, Pleasant Lea Middle School, and Lee's Summit Senior High School.
Ownership History
Date
Name
Owned For
Owner Type
Purchase Details
Closed on
Aug 29, 1995
Sold by
Cerra & Sons Construction Inc
Bought by
Nonnemaker Philip E and Nonnemaker Jean Ann
Current Estimated Value
Home Financials for this Owner
Home Financials are based on the most recent Mortgage that was taken out on this home.
Original Mortgage
$174,000
Interest Rate
7.6%
Mortgage Type
Purchase Money Mortgage
Purchase Details
Closed on
Aug 21, 1995
Sold by
Richard Link Construction Co Inc
Bought by
Cerra & Sons
Home Financials for this Owner
Home Financials are based on the most recent Mortgage that was taken out on this home.
Original Mortgage
$174,000
Interest Rate
7.6%
Mortgage Type
Purchase Money Mortgage
Create a Home Valuation Report for This Property
The Home Valuation Report is an in-depth analysis detailing your home's value as well as a comparison with similar homes in the area
Home Values in the Area
Average Home Value in this Area
Purchase History
| Date | Buyer | Sale Price | Title Company |
|---|---|---|---|
| Nonnemaker Philip E | -- | Chicago Title Insurance Co | |
| Cerra & Sons | -- | -- |
Source: Public Records
Mortgage History
| Date | Status | Borrower | Loan Amount |
|---|---|---|---|
| Closed | Nonnemaker Philip E | $174,000 | |
| Closed | Cerra & Sons | $174,000 |
Source: Public Records
Tax History
| Year | Tax Paid | Tax Assessment Tax Assessment Total Assessment is a certain percentage of the fair market value that is determined by local assessors to be the total taxable value of land and additions on the property. | Land | Improvement |
|---|---|---|---|---|
| 2025 | $5,350 | $81,915 | $10,441 | $71,474 |
| 2024 | $5,350 | $74,100 | $11,210 | $62,890 |
| 2023 | $5,312 | $74,100 | $11,210 | $62,890 |
| 2022 | $5,000 | $61,940 | $6,156 | $55,784 |
| 2021 | $5,104 | $61,940 | $6,156 | $55,784 |
| 2020 | $4,909 | $58,998 | $6,156 | $52,842 |
| 2019 | $4,775 | $58,998 | $6,156 | $52,842 |
| 2018 | $998,082 | $51,348 | $5,358 | $45,990 |
| 2017 | $4,478 | $51,348 | $5,358 | $45,990 |
| 2016 | $3,934 | $44,651 | $6,090 | $38,561 |
Source: Public Records
Map
Nearby Homes
- 413 SE Ashton Dr
- 532 SE Asheville Dr
- 521 SE Asheville Dr
- 2205 SE Meeting St
- 312 SE Battery Dr
- 2213 SE 3rd St
- 505 SE Onyx Dr
- 113 SE Bristol Dr
- 302 SE Flagstone Dr
- 100 NE Keystone Dr
- 1604 SE 11th St
- 116 NE Greystone Dr
- 503 NE Legacy Wood Cir
- 410 NE Corsicana St
- 707 NE Sundance Trail
- 2300 NE Silver Spring Ln
- 1023 SE Timbercreek Ln
- 24002 E Langsford Rd
- 1321 SE Princeton Dr
- 725 NE Lyon Dr
- 2418 SE 5th Terrace
- 2426 SE 5th Terrace
- 2427 SE 5th Terrace
- 2423 SE 5th Terrace
- 2430 SE 5th Terrace
- 2431 SE 5th Terrace
- 2419 SE 5th Terrace
- 2414 SE 5th Terrace
- 2417 SE 5th St
- 2421 SE 5th St
- 2413 SE 5th St
- 2415 SE 5th Terrace
- 2425 SE 5th St
- 2434 SE 5th Terrace
- 2410 SE 5th Terrace
- 2428 SE 6th St
- 2409 SE 5th St
- 2424 SE 6th St
- 2429 SE 5th St
- 2411 SE 5th Terrace
Your Personal Tour Guide
Ask me questions while you tour the home.