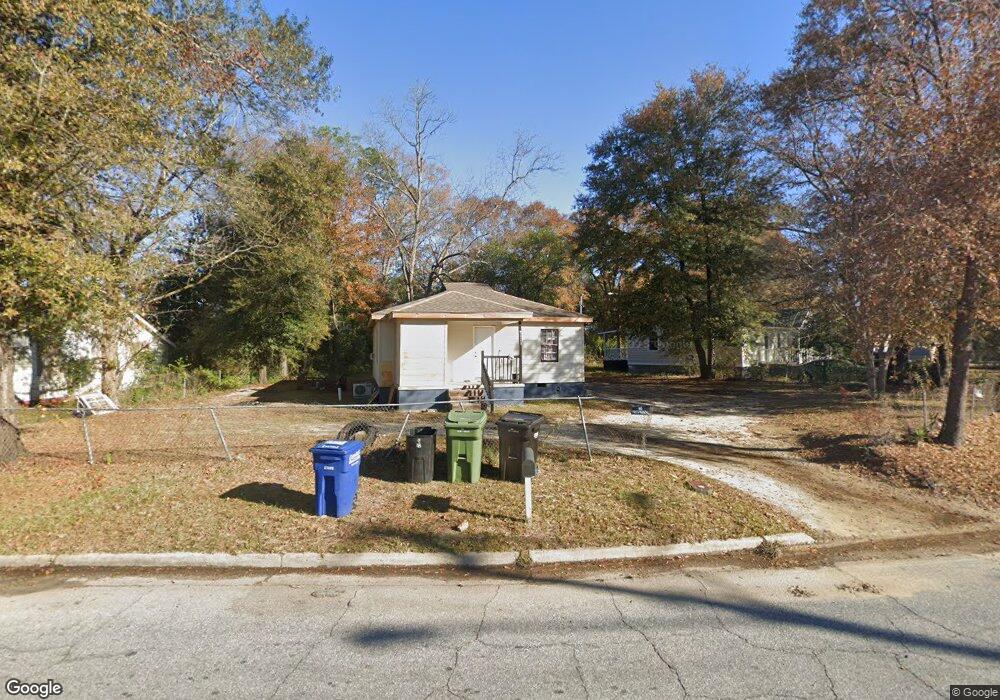
2423 Clover Ln Columbus, GA 31903
Southern Columbus NeighborhoodEstimated Value: $39,000 - $65,000
2
Beds
1
Bath
784
Sq Ft
$62/Sq Ft
Est. Value
About This Home
This home is located at 2423 Clover Ln, Columbus, GA 31903 and is currently estimated at $48,897, approximately $62 per square foot. 2423 Clover Ln is a home located in Muscogee County with nearby schools including Martin Luther King Jr. Elementary School, Baker Middle School, and Carver High School.
Ownership History
Date
Name
Owned For
Owner Type
Purchase Details
Closed on
Mar 9, 2020
Sold by
Hudson David Lee
Bought by
Smith Terrance and Hicks Quincy
Current Estimated Value
Purchase Details
Closed on
Aug 4, 2014
Sold by
Chi Asset Management Llc
Bought by
Hudson David Lee
Purchase Details
Closed on
May 2, 2012
Sold by
Columbus Georgia
Bought by
Chi Asset Management Llc
Purchase Details
Closed on
Mar 14, 2012
Sold by
Chi Asset Management Llc
Bought by
Columbus Georgia
Purchase Details
Closed on
Dec 1, 2010
Sold by
Columbus Housing Initiative Inc
Bought by
Chi Asset Management Llc
Purchase Details
Closed on
Nov 6, 2009
Sold by
The Bank Of New York Mellon Trust Compan
Bought by
Columbus Housing Initiative Inc
Purchase Details
Closed on
Aug 4, 2009
Sold by
Thomas James E and Mortgage Electronic Registrati
Bought by
The Bank Of New York Mellon Trust Compan and The Bank Of New York Trust Company Na
Create a Home Valuation Report for This Property
The Home Valuation Report is an in-depth analysis detailing your home's value as well as a comparison with similar homes in the area
Home Values in the Area
Average Home Value in this Area
Purchase History
| Date | Buyer | Sale Price | Title Company |
|---|---|---|---|
| Smith Terrance | $4,000 | -- | |
| Hudson David Lee | $6,000 | -- | |
| Chi Asset Management Llc | -- | -- | |
| Columbus Georgia | -- | -- | |
| Chi Asset Management Llc | -- | None Available | |
| Columbus Housing Initiative Inc | $9,900 | None Available | |
| The Bank Of New York Mellon Trust Compan | $11,920 | None Available |
Source: Public Records
Tax History Compared to Growth
Tax History
| Year | Tax Paid | Tax Assessment Tax Assessment Total Assessment is a certain percentage of the fair market value that is determined by local assessors to be the total taxable value of land and additions on the property. | Land | Improvement |
|---|---|---|---|---|
| 2025 | $603 | $15,408 | $3,036 | $12,372 |
| 2024 | $611 | $15,608 | $3,236 | $12,372 |
| 2023 | $615 | $15,608 | $3,236 | $12,372 |
| 2022 | $514 | $12,600 | $3,236 | $9,364 |
| 2021 | $83 | $1,824 | $1,824 | $0 |
| 2020 | $432 | $10,572 | $3,236 | $7,336 |
| 2019 | $433 | $10,572 | $3,236 | $7,336 |
| 2018 | $433 | $10,572 | $3,236 | $7,336 |
| 2017 | $435 | $10,572 | $3,236 | $7,336 |
| 2016 | $193 | $4,674 | $2,519 | $2,155 |
| 2015 | $99 | $2,400 | $1,100 | $1,300 |
| 2014 | $104 | $2,519 | $2,519 | $0 |
| 2013 | $104 | $2,519 | $2,519 | $0 |
Source: Public Records
Map
Nearby Homes
- 430 Mellon St
- 434 Mellon St
- 2603 Dawson St
- 0 Mellon St
- 2516 Dawson St
- 2716 Garden Dr
- 2713 Dawson St
- 139 28th Ave
- 136 28th Ave
- 134 28th Ave
- 362 29th Ave
- 2505 Lumpkin Ct
- 2721 Lee St
- 3324 Hal's Way
- 310 Bragg Smith St
- 2823 Lee St
- 2318 Huggins St
- 2938 Martin Luther King jr Blvd
- 2731 Lumpkin Ct
- 2415 - 2417 6th St