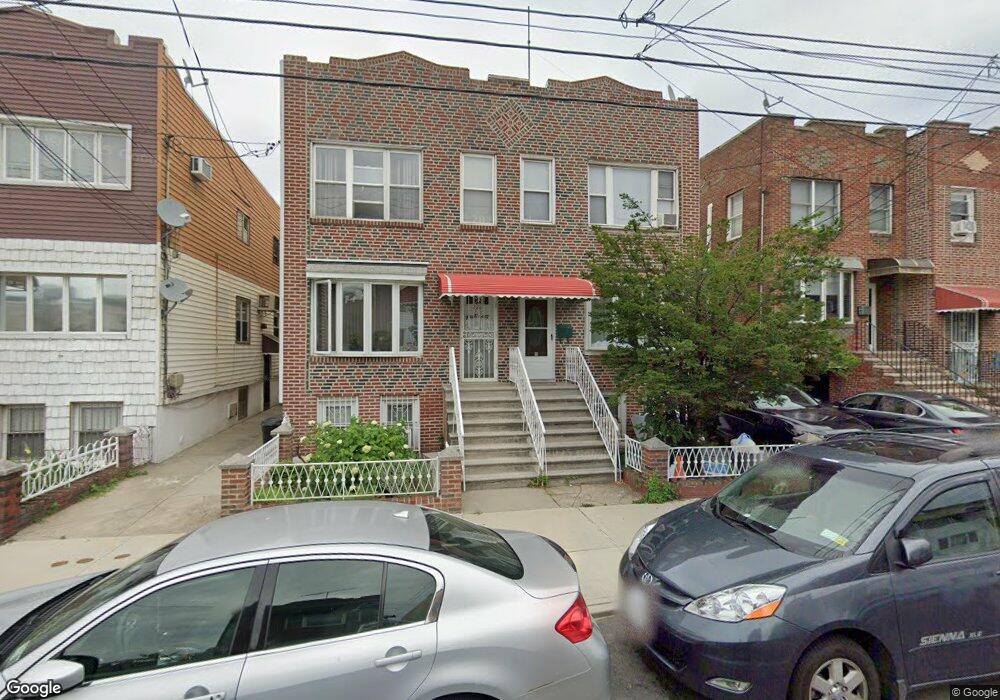
2423 W 3rd St Brooklyn, NY 11223
Gravesend NeighborhoodEstimated Value: $1,115,250 - $1,342,000
Studio
--
Bath
2,736
Sq Ft
$445/Sq Ft
Est. Value
About This Home
This home is located at 2423 W 3rd St, Brooklyn, NY 11223 and is currently estimated at $1,218,063, approximately $445 per square foot. 2423 W 3rd St is a home located in Kings County with nearby schools including P.S. 216 Arturo Toscanini, I.S. 303 Herbert S. Eisenberg, and Abraham Lincoln High School.
Ownership History
Date
Name
Owned For
Owner Type
Purchase Details
Closed on
Nov 11, 2025
Sold by
Penhasov Matatia
Bought by
Mbp 2025 Irrevocable Trust and Penhasov As Trustee Branden
Current Estimated Value
Purchase Details
Closed on
Aug 13, 2019
Sold by
Penhasov Matatia and Penhasov Turi
Bought by
Penhasov 2019 Family Trust and Penhasov As Trustee Matatia
Purchase Details
Closed on
Jun 3, 1999
Sold by
Tosson Nawal
Bought by
Penhasov Matatia and Penhasov Turi
Home Financials for this Owner
Home Financials are based on the most recent Mortgage that was taken out on this home.
Original Mortgage
$210,000
Interest Rate
7.78%
Mortgage Type
Purchase Money Mortgage
Purchase Details
Closed on
Apr 17, 1997
Sold by
Ho Chiu Stephen Ming and Chiu Stanley K
Bought by
Tosson Nawal
Home Financials for this Owner
Home Financials are based on the most recent Mortgage that was taken out on this home.
Original Mortgage
$217,600
Interest Rate
8.09%
Mortgage Type
Purchase Money Mortgage
Create a Home Valuation Report for This Property
The Home Valuation Report is an in-depth analysis detailing your home's value as well as a comparison with similar homes in the area
Home Values in the Area
Average Home Value in this Area
Purchase History
| Date | Buyer | Sale Price | Title Company |
|---|---|---|---|
| Mbp 2025 Irrevocable Trust | -- | -- | |
| Penhasov 2019 Family Trust | -- | -- | |
| Penhasov Matatia | $280,000 | -- | |
| Tosson Nawal | $272,000 | First American Title Ins Co |
Source: Public Records
Mortgage History
| Date | Status | Borrower | Loan Amount |
|---|---|---|---|
| Previous Owner | Penhasov Matatia | $210,000 | |
| Previous Owner | Tosson Nawal | $217,600 |
Source: Public Records
Tax History
| Year | Tax Paid | Tax Assessment Tax Assessment Total Assessment is a certain percentage of the fair market value that is determined by local assessors to be the total taxable value of land and additions on the property. | Land | Improvement |
|---|---|---|---|---|
| 2025 | $7,354 | $79,500 | $9,420 | $70,080 |
| 2024 | $7,354 | $88,680 | $9,420 | $79,260 |
| 2023 | $3,226 | $77,820 | $9,420 | $68,400 |
| 2022 | $2,209 | $85,260 | $9,420 | $75,840 |
| 2021 | $3,120 | $65,820 | $9,420 | $56,400 |
| 2019 | $2,864 | $66,240 | $9,420 | $56,820 |
| 2018 | $2,591 | $31,886 | $4,727 | $27,159 |
| 2017 | $2,422 | $30,097 | $5,097 | $25,000 |
| 2016 | $2,698 | $30,097 | $6,878 | $23,219 |
| 2015 | $3,205 | $29,733 | $10,164 | $19,569 |
| 2014 | $3,205 | $28,066 | $9,594 | $18,472 |
Source: Public Records
Map
Nearby Homes
- 2456 W 2nd St
- 310 Avenue X
- 2421 W 1st St
- 2481 W 2nd St
- 366 Avenue Y Unit 3-A
- 2450 West St
- 2397 Boynton Place Unit 3B
- 67 Stryker St
- 2547 W 2nd St Unit 1-J
- 2547 W 2nd St Unit 1K
- 2569 W 2nd St Unit 4G
- 2569 W 2nd St Unit 4F
- 475 Avenue Y
- 472 Lake St
- 462 Lake St
- 2416 McDonald Ave
- 2555 West St
- 480 Van Sicklen St
- 2400 E 3rd St Unit 403
- 2400 E 3rd St Unit 317