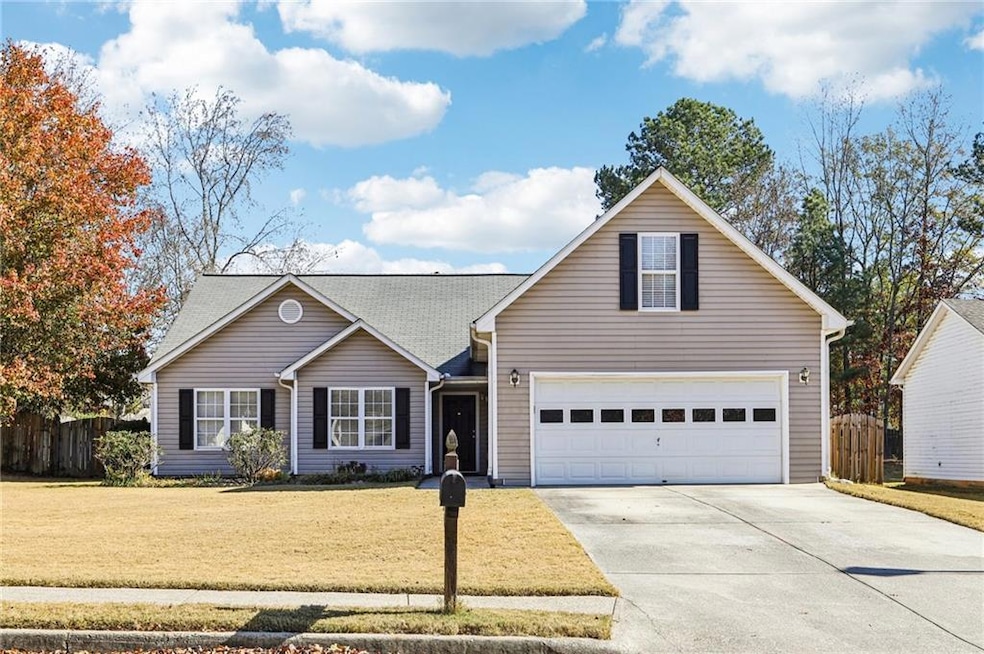
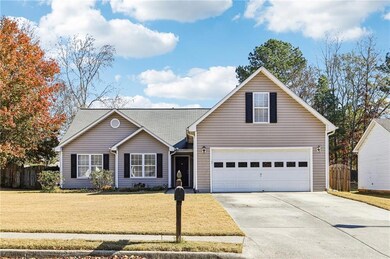
2425 Fort Daniels Dr Unit 3A Dacula, GA 30019
Estimated payment $2,162/month
Highlights
- Colonial Architecture
- Dining Room Seats More Than Twelve
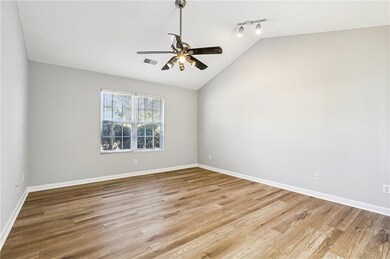
- Oversized primary bedroom
- Fort Daniel Elementary School Rated A
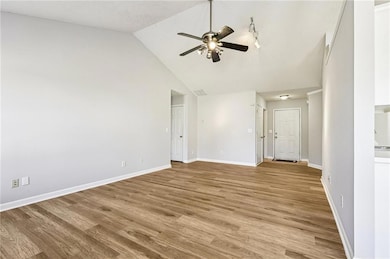
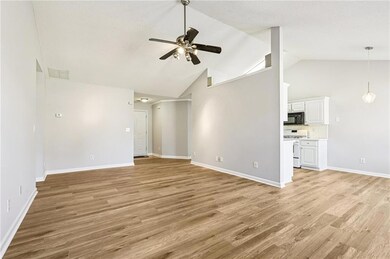
- Vaulted Ceiling
- Attic
About This Home
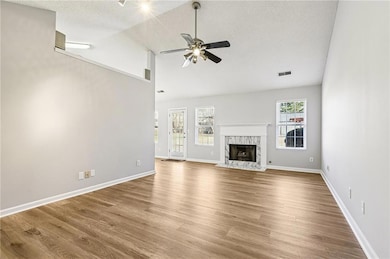
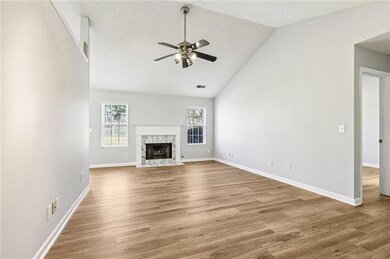
Beautiful like new ranch home perfect in every way! Freshly painted and all new luxury laminate flooring on main level. Great room is vaulted with a beautiful fireplace for cozy nights. Upstairs bonus room is oversized. White kitchen has plenty of counter space, beautiful backsplash with breakfast area overlooking private backyard. Huge dining room faces front of home with French doors for added privacy and flexibility. The primary ensuite is oversized with ample closet space, new flooring, double vanities and separate tub and shower. The secondary bedrooms are nice size with walk in closets. Great private lot is very level front and back for gardening, pets and kids to roam free! Easy quiet walk to Fort Daniels Elementary School! Must see this perfectly maintained gem!

Home Details
Home Type
- Single Family
Est. Annual Taxes
- $3,568
Year Built
- Built in 1999
Lot Details
- 0.25 Acre Lot
- Property fronts a county road
- Private Entrance
- Wood Fence
- Level Lot
- Back Yard Fenced and Front Yard
HOA Fees
- $20 Monthly HOA Fees
Parking
- 2 Car Attached Garage
- Parking Accessed On Kitchen Level
- Front Facing Garage
- Garage Door Opener
- Driveway Level
Home Design
- Colonial Architecture
- 1.5-Story Property
- Traditional Architecture
- Slab Foundation
- Ridge Vents on the Roof
- Composition Roof
- Vinyl Siding
Interior Spaces
- 1,812 Sq Ft Home
- Vaulted Ceiling
- Ceiling Fan
- Factory Built Fireplace
- Fireplace With Gas Starter
- Double Pane Windows
- Insulated Windows
- Window Treatments
- Entrance Foyer
- Great Room with Fireplace
- Dining Room Seats More Than Twelve
- Formal Dining Room
- Bonus Room
- Neighborhood Views
- Pull Down Stairs to Attic
- Fire and Smoke Detector
Kitchen
- Breakfast Room
- Eat-In Kitchen
- Electric Oven
- Electric Cooktop
- Range Hood
- Dishwasher
- Laminate Countertops
- White Kitchen Cabinets
- Disposal
Flooring
- Carpet
- Laminate
Bedrooms and Bathrooms
- Oversized primary bedroom
- 4 Bedrooms | 3 Main Level Bedrooms
- Primary Bedroom on Main
- Split Bedroom Floorplan
- Walk-In Closet
- 2 Full Bathrooms
- Dual Vanity Sinks in Primary Bathroom
- Separate Shower in Primary Bathroom
- Soaking Tub
Laundry
- Laundry Room
- Laundry in Hall
- Laundry on main level
- Electric Dryer Hookup
Outdoor Features
- Patio
- Outdoor Storage
- Outbuilding
- Front Porch
Location
- Property is near schools
- Property is near shops
Schools
- Fort Daniel Elementary School
- Osborne Middle School
- Mill Creek High School
Utilities
- Forced Air Heating and Cooling System
- Air Source Heat Pump
- Heating System Uses Natural Gas
- Underground Utilities
- 110 Volts
- High Speed Internet
- Phone Available
- Cable TV Available
Community Details
Overview
- Apalachee Plantation Subdivision
Recreation
- Park
Map
Home Values in the Area
Average Home Value in this Area
Tax History
| Year | Tax Paid | Tax Assessment Tax Assessment Total Assessment is a certain percentage of the fair market value that is determined by local assessors to be the total taxable value of land and additions on the property. | Land | Improvement |
|---|---|---|---|---|
| 2025 | $3,650 | $143,640 | $36,080 | $107,560 |
| 2024 | $3,568 | $133,400 | $29,600 | $103,800 |
| 2023 | $3,568 | $127,360 | $29,600 | $97,760 |
| 2022 | $3,146 | $114,760 | $24,800 | $89,960 |
| 2021 | $2,641 | $88,480 | $18,640 | $69,840 |
| 2020 | $2,406 | $76,680 | $17,120 | $59,560 |
| 2019 | $2,353 | $76,680 | $17,120 | $59,560 |
| 2018 | $2,231 | $71,080 | $15,600 | $55,480 |
| 2016 | $2,075 | $62,920 | $12,400 | $50,520 |
| 2015 | $1,945 | $56,360 | $10,400 | $45,960 |
| 2014 | $1,826 | $50,560 | $10,400 | $40,160 |
Property History
| Date | Event | Price | List to Sale | Price per Sq Ft |
|---|---|---|---|---|
| 11/20/2025 11/20/25 | For Sale | $350,000 | -- | $193 / Sq Ft |
Purchase History
| Date | Type | Sale Price | Title Company |
|---|---|---|---|
| Deed | $152,500 | -- | |
| Quit Claim Deed | -- | -- | |
| Deed | $114,100 | -- |
Mortgage History
| Date | Status | Loan Amount | Loan Type |
|---|---|---|---|
| Open | $150,118 | VA | |
| Previous Owner | $126,000 | New Conventional | |
| Previous Owner | $110,600 | New Conventional |
Source: First Multiple Listing Service (FMLS)
MLS Number: 7683739
APN: 3-001E-086
Disclaimer: Certain information contained herein is derived from information provided by parties other than Homes.com. All information provided is deemed reliable, but is not guaranteed to be accurate and should be independently verified.
![]() Listings identified with the FMLS IDX logo come from FMLS and are held by brokerage firms other than the owner of this website. The listing brokerage is identified in any listing details. Information is deemed reliable but is not guaranteed. If you believe any FMLS listing contains material that infringes your copyrighted work please visit www.fmls.com/dmca to review our DMCA policy and learn how to submit a takedown request. © 2025 First Multiple Listing Service, Inc.
Listings identified with the FMLS IDX logo come from FMLS and are held by brokerage firms other than the owner of this website. The listing brokerage is identified in any listing details. Information is deemed reliable but is not guaranteed. If you believe any FMLS listing contains material that infringes your copyrighted work please visit www.fmls.com/dmca to review our DMCA policy and learn how to submit a takedown request. © 2025 First Multiple Listing Service, Inc.
- 1603 Fort Perry Way
- 1720 Fort Daniels Trail
- 2515 Fort Daniels Dr
- 1655 Brisbane Dr
- 2416 Moultrie Ct
- 2431 Lance Ridge Way
- 1827 Scouts Walk
- 2706 Captain Ct
- 2439 Canter Brook Ct Unit 1
- 1573 Vinings Ct
- 1717 Willoughby Dr
- 2032 Shin Ct NE
- 2765 Daniel Park Run Unit 3
- 2628 Adair Trail
- 1618 Rocky Knoll Ln
- 2687 High Creek Run
- 2674 Rocky Knoll Ct
- 2717 Fort Hampton Ct
- 2727 Fort Hampton Ct
- 1849 Mapmaker Dr NE
- 2685 Fort Daniels Dr NE
- 2510 Cordillo Dr
- 2524 Dalesford Ct
- 1390 Brisbane Dr
- 1453 Whitaker Park Place
- 1535 Heatherton Rd
- 2673 Back Creek Chase
- 2290 Castle Royale Dr
- 1821 Binnies Way
- 2479 Heatherton Ct
- 2489 Heatherton Ct
- 1715 Heatherton Rd
- 2052 Windsor Park Ave
- 2747 Rocky Trail Ct
- 2110 Heatherton Rd
- 1335 Heatherton Rd
- 1363 Wilkes Crest Ct