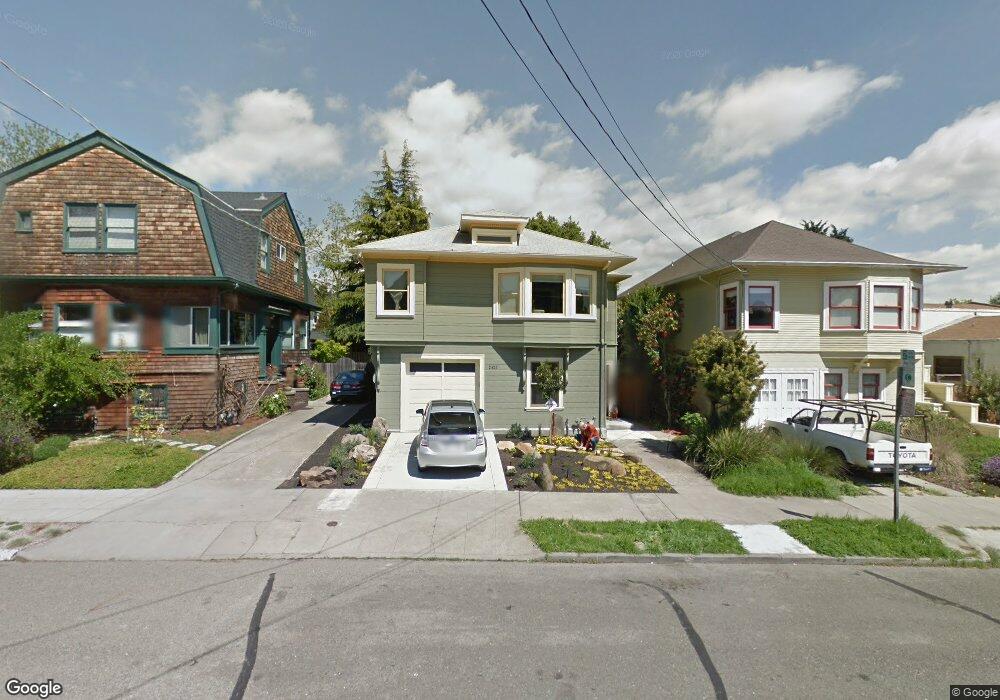
2425 Roosevelt Ave Berkeley, CA 94703
Downtown Berkeley NeighborhoodEstimated Value: $1,519,000 - $2,078,000
3
Beds
3
Baths
2,485
Sq Ft
$719/Sq Ft
Est. Value
About This Home
This home is located at 2425 Roosevelt Ave, Berkeley, CA 94703 and is currently estimated at $1,786,952, approximately $719 per square foot. 2425 Roosevelt Ave is a home located in Alameda County with nearby schools including Washington Elementary School, Malcolm X Elementary School, and Berkeley Arts Magnet at Whittier School.
Ownership History
Date
Name
Owned For
Owner Type
Purchase Details
Closed on
Mar 11, 2011
Sold by
Baer Properties Llc
Bought by
Moore Don A and Moore Sarah M
Current Estimated Value
Home Financials for this Owner
Home Financials are based on the most recent Mortgage that was taken out on this home.
Original Mortgage
$565,500
Outstanding Balance
$439,035
Interest Rate
5.02%
Mortgage Type
New Conventional
Estimated Equity
$1,347,917
Purchase Details
Closed on
Feb 2, 2011
Sold by
Baehrend David J and Vanderburg Karen
Bought by
Baer Properties Llc
Home Financials for this Owner
Home Financials are based on the most recent Mortgage that was taken out on this home.
Original Mortgage
$565,500
Outstanding Balance
$439,035
Interest Rate
5.02%
Mortgage Type
New Conventional
Estimated Equity
$1,347,917
Purchase Details
Closed on
Aug 20, 2010
Sold by
Doiel Nancy B and Estate Of Namiko Baba
Bought by
Baehiend David J and Vanderburg Karen
Create a Home Valuation Report for This Property
The Home Valuation Report is an in-depth analysis detailing your home's value as well as a comparison with similar homes in the area
Home Values in the Area
Average Home Value in this Area
Purchase History
| Date | Buyer | Sale Price | Title Company |
|---|---|---|---|
| Moore Don A | $965,500 | Old Republic Title Company | |
| Baer Properties Llc | -- | Old Republic Title Company | |
| Baehiend David J | $370,000 | Old Republic Title Company |
Source: Public Records
Mortgage History
| Date | Status | Borrower | Loan Amount |
|---|---|---|---|
| Open | Moore Don A | $565,500 |
Source: Public Records
Tax History
| Year | Tax Paid | Tax Assessment Tax Assessment Total Assessment is a certain percentage of the fair market value that is determined by local assessors to be the total taxable value of land and additions on the property. | Land | Improvement |
|---|---|---|---|---|
| 2025 | $18,716 | $1,229,901 | $371,006 | $865,895 |
| 2024 | $18,716 | $1,205,657 | $363,734 | $848,923 |
| 2023 | $18,327 | $1,188,886 | $356,604 | $832,282 |
| 2022 | $17,998 | $1,158,579 | $349,613 | $815,966 |
| 2021 | $18,044 | $1,135,726 | $342,758 | $799,968 |
| 2020 | $17,071 | $1,131,015 | $339,246 | $791,769 |
| 2019 | $16,398 | $1,108,846 | $332,596 | $776,250 |
| 2018 | $16,124 | $1,087,114 | $326,078 | $761,036 |
| 2017 | $15,576 | $1,065,805 | $319,686 | $746,119 |
| 2016 | $15,081 | $1,044,911 | $313,419 | $731,492 |
| 2015 | $14,880 | $1,029,222 | $308,713 | $720,509 |
| 2014 | $14,726 | $1,009,062 | $302,666 | $706,396 |
Source: Public Records
Map
Nearby Homes
- 1634 Blake St
- 1604 Dwight Way
- 1901 Parker St Unit 3
- 1819 Carleton St
- 1612 Parker St
- 1524 Blake St
- 2701 Grant St
- 2218 -2222 Grant St
- 2350 Sacramento St
- 1515 Derby St
- 2118 California St
- 2437 Acton St
- 2304 Edwards St
- 2750 Sacramento St
- 1450 Ward St
- 2758 Sacramento St
- 2774 Sacramento St
- 2782 Sacramento St
- 2829 California St
- 2790 Sacramento St
- 2429 Roosevelt Ave
- 2423 Roosevelt Ave Unit 1/2
- 2423 Roosevelt Ave
- 2433 Roosevelt Ave
- 2419 Roosevelt Ave
- 2421 Roosevelt Ave
- 2435 Roosevelt Ave
- 2422 Grant St
- 2415 Roosevelt Ave
- 2430 Grant St
- 2418 Grant St
- 2437 Roosevelt Ave
- 2432 Grant St
- 2411 Roosevelt Ave
- 2420 Grant St
- 2416 Grant St
- 2422 Roosevelt Ave
- 2440 Grant St
- 2439 Roosevelt Ave
- 2420 Roosevelt Ave
Your Personal Tour Guide
Ask me questions while you tour the home.