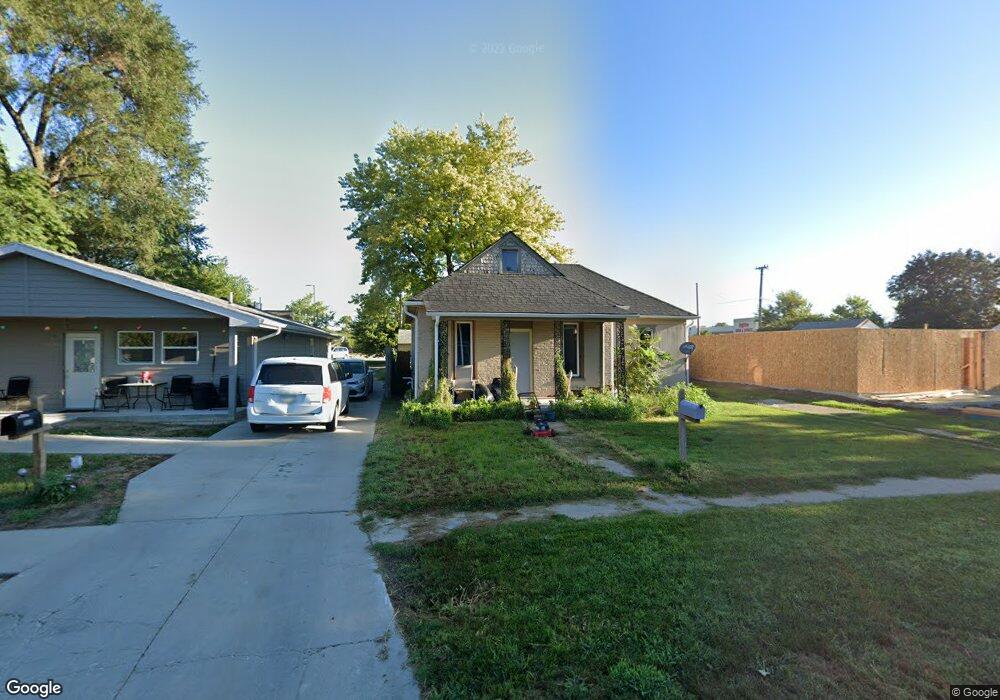
2426 2nd Ave Council Bluffs, IA 51501
Cochran Park NeighborhoodEstimated Value: $117,000 - $168,000
3
Beds
1
Bath
1,276
Sq Ft
$115/Sq Ft
Est. Value
About This Home
This home is located at 2426 2nd Ave, Council Bluffs, IA 51501 and is currently estimated at $146,305, approximately $114 per square foot. 2426 2nd Ave is a home located in Pottawattamie County with nearby schools including Edison Elementary School, Woodrow Wilson Middle School, and Thomas Jefferson High School.
Ownership History
Date
Name
Owned For
Owner Type
Purchase Details
Closed on
Dec 1, 2021
Sold by
R & R Equities Llc
Bought by
Mac Investments Inc
Current Estimated Value
Purchase Details
Closed on
Feb 12, 2019
Sold by
R & R Equities
Bought by
Hansen Kasleb J
Home Financials for this Owner
Home Financials are based on the most recent Mortgage that was taken out on this home.
Original Mortgage
$41,000
Interest Rate
10%
Mortgage Type
Land Contract Argmt. Of Sale
Purchase Details
Closed on
Sep 13, 2018
Sold by
Breitenstein Destiny Rose
Bought by
Tr & R Equities Llc
Create a Home Valuation Report for This Property
The Home Valuation Report is an in-depth analysis detailing your home's value as well as a comparison with similar homes in the area
Home Values in the Area
Average Home Value in this Area
Purchase History
| Date | Buyer | Sale Price | Title Company |
|---|---|---|---|
| Mac Investments Inc | -- | None Listed On Document | |
| Hansen Kasleb J | $41,000 | None Available | |
| Tr & R Equities Llc | -- | None Available |
Source: Public Records
Mortgage History
| Date | Status | Borrower | Loan Amount |
|---|---|---|---|
| Previous Owner | Hansen Kasleb J | $41,000 |
Source: Public Records
Tax History Compared to Growth
Tax History
| Year | Tax Paid | Tax Assessment Tax Assessment Total Assessment is a certain percentage of the fair market value that is determined by local assessors to be the total taxable value of land and additions on the property. | Land | Improvement |
|---|---|---|---|---|
| 2025 | $2,186 | $124,500 | $26,400 | $98,100 |
| 2024 | $2,186 | $108,500 | $22,900 | $85,600 |
| 2023 | $2,504 | $108,500 | $22,900 | $85,600 |
| 2022 | $2,574 | $95,500 | $25,100 | $70,400 |
| 2021 | $3,290 | $95,500 | $25,100 | $70,400 |
| 2020 | $2,715 | $84,100 | $20,100 | $64,000 |
| 2019 | $1,847 | $82,500 | $20,100 | $62,400 |
| 2018 | $1,995 | $67,354 | $10,517 | $56,837 |
| 2017 | $1,886 | $67,354 | $10,517 | $56,837 |
| 2015 | $1,922 | $67,354 | $10,517 | $56,837 |
| 2014 | $1,934 | $67,354 | $10,517 | $56,837 |
Source: Public Records
Map
Nearby Homes