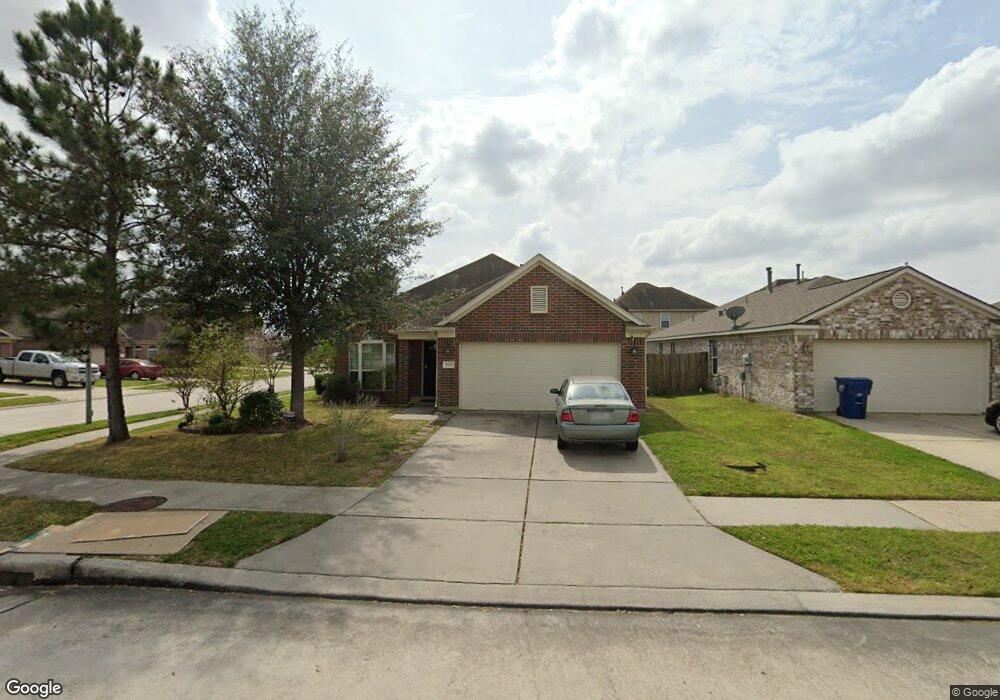
2426 Lofty Falls Ct Spring, TX 77386
Estimated Value: $245,862 - $267,000
3
Beds
2
Baths
1,603
Sq Ft
$159/Sq Ft
Est. Value
About This Home
This home is located at 2426 Lofty Falls Ct, Spring, TX 77386 and is currently estimated at $254,716, approximately $158 per square foot. 2426 Lofty Falls Ct is a home located in Montgomery County with nearby schools including A. Davis Ford Elementary School, Vogel Intermediate School, and Irons J High School.
Ownership History
Date
Name
Owned For
Owner Type
Purchase Details
Closed on
Aug 5, 2016
Sold by
Urban Chrystal N and Stalder William Vere
Bought by
Guajardo Jaime
Current Estimated Value
Home Financials for this Owner
Home Financials are based on the most recent Mortgage that was taken out on this home.
Original Mortgage
$157,887
Outstanding Balance
$126,300
Interest Rate
3.56%
Mortgage Type
FHA
Estimated Equity
$128,416
Purchase Details
Closed on
May 28, 2008
Sold by
Long Lake Ltd
Bought by
Urban Chrystal N
Home Financials for this Owner
Home Financials are based on the most recent Mortgage that was taken out on this home.
Original Mortgage
$108,260
Interest Rate
5.89%
Mortgage Type
Purchase Money Mortgage
Purchase Details
Closed on
Jun 25, 2007
Sold by
Woodmere Development Co Ltd
Bought by
Guarjardo Jaime
Create a Home Valuation Report for This Property
The Home Valuation Report is an in-depth analysis detailing your home's value as well as a comparison with similar homes in the area
Purchase History
| Date | Buyer | Sale Price | Title Company |
|---|---|---|---|
| Guajardo Jaime | -- | Homeland Title Company | |
| Urban Chrystal N | -- | American Title Company | |
| Guarjardo Jaime | -- | -- |
Source: Public Records
Mortgage History
| Date | Status | Borrower | Loan Amount |
|---|---|---|---|
| Open | Guajardo Jaime | $157,887 | |
| Previous Owner | Urban Chrystal N | $108,260 |
Source: Public Records
Tax History
| Year | Tax Paid | Tax Assessment Tax Assessment Total Assessment is a certain percentage of the fair market value that is determined by local assessors to be the total taxable value of land and additions on the property. | Land | Improvement |
|---|---|---|---|---|
| 2025 | $2,506 | $250,211 | $42,500 | $207,711 |
| 2024 | $2,506 | $234,157 | -- | -- |
| 2023 | $4,470 | $259,100 | $42,500 | $216,600 |
| 2022 | $6,064 | $229,260 | $42,500 | $186,760 |
| 2021 | $4,959 | $175,930 | $42,500 | $133,430 |
| 2020 | $4,932 | $167,520 | $24,060 | $143,460 |
| 2019 | $4,714 | $156,370 | $24,060 | $132,310 |
| 2018 | $4,328 | $143,570 | $24,060 | $119,510 |
| 2017 | $4,326 | $143,640 | $24,060 | $119,580 |
| 2016 | $4,262 | $141,530 | $24,060 | $119,950 |
| 2015 | $3,342 | $128,660 | $24,060 | $112,900 |
| 2014 | $3,342 | $116,960 | $24,060 | $92,900 |
Source: Public Records
Map
Nearby Homes
- 29426 Winton Wood Way
- 29491 Forest Floor Ln
- 29475 Forest Floor Ln
- 29433 Forest Floor Ln
- 2415 Fox River Ln
- 2306 Garden Square Path
- 29322 Fair Sky Trail
- 29341 Forest Floor Ln
- 29051 Birch Green Way
- 2269 Garden Square Path
- 2534 Halstead Dr
- 29418 Ridge Clearing Trail
- 29311 Nectar Bloom Ct
- 2119 Old ox Rd
- 2322 Shadow Glen Ln
- 29219 Waltham St
- 29322 Indian Clearing Trail
- 29627 Spring Forest Dr
- 2615 Magnolia Fair Way
- 29119 Fox Fountain Ln
- 2422 Lofty Falls Ct
- 2418 Lofty Falls Ct
- 29322 Turnbury Village Dr
- 29326 Turnbury Village Dr
- 29414 Winton Wood Way
- 29330 Turnbury Village Dr
- 29410 Winton Wood Way
- 29418 Winton Wood Way
- 2414 Lofty Falls Ct
- 2423 Lofty Falls Ct
- 2419 Lofty Falls Ct
- 29406 Winton Wood Way
- 29422 Winton Wood Way
- 29334 Turnbury Village Dr
- 2415 Lofty Falls Ct
- 2410 Lofty Falls Ct
- 29402 Winton Wood Way
- 29338 Turnbury Village Dr
- 29430 Winton Wood Way
- 2406 Lofty Falls Ct
Your Personal Tour Guide
Ask me questions while you tour the home.