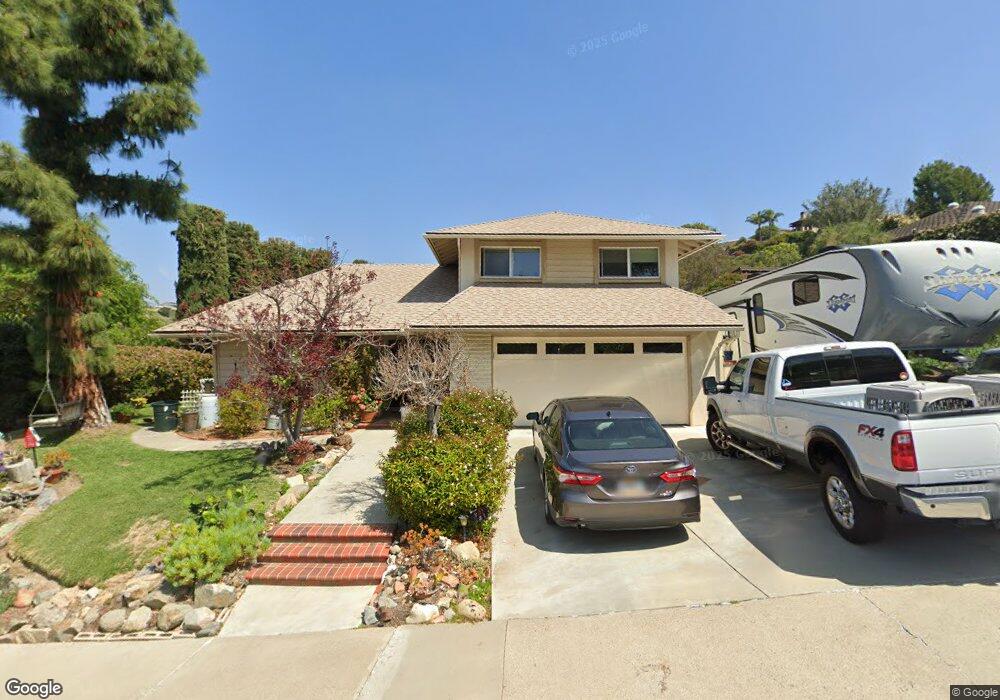
24261 Los Serranos Dr Laguna Niguel, CA 92677
Estimated Value: $1,320,000 - $1,787,000
4
Beds
2
Baths
1,814
Sq Ft
$892/Sq Ft
Est. Value
About This Home
This home is located at 24261 Los Serranos Dr, Laguna Niguel, CA 92677 and is currently estimated at $1,618,784, approximately $892 per square foot. 24261 Los Serranos Dr is a home located in Orange County with nearby schools including Hidden Hills Elementary, Niguel Hills Middle School, and Dana Hills High School.
Ownership History
Date
Name
Owned For
Owner Type
Purchase Details
Closed on
Jul 24, 2019
Sold by
Young Patricia Ann
Bought by
Young Patricia Ann and Patricia Ann Sanchez Young Trust
Current Estimated Value
Purchase Details
Closed on
Jun 26, 2017
Sold by
Young Patricia and Young Patricia Ann
Bought by
Young Patricia Ann
Home Financials for this Owner
Home Financials are based on the most recent Mortgage that was taken out on this home.
Original Mortgage
$600,500
Outstanding Balance
$500,687
Interest Rate
4.02%
Mortgage Type
New Conventional
Estimated Equity
$1,118,097
Purchase Details
Closed on
Jun 29, 2005
Sold by
Young Scott Allen
Bought by
Young Patricia Ann
Purchase Details
Closed on
Jan 3, 1995
Sold by
Dinkel John G and Dinkel Leslie H
Bought by
Young Scott Allen and Young Patricia Ann
Create a Home Valuation Report for This Property
The Home Valuation Report is an in-depth analysis detailing your home's value as well as a comparison with similar homes in the area
Home Values in the Area
Average Home Value in this Area
Purchase History
| Date | Buyer | Sale Price | Title Company |
|---|---|---|---|
| Young Patricia Ann | -- | None Available | |
| Young Patricia Ann | -- | Bnt Title Company Of Califor | |
| Young Patricia Ann | -- | Security Union Title | |
| Young Scott Allen | $206,000 | First American Title |
Source: Public Records
Mortgage History
| Date | Status | Borrower | Loan Amount |
|---|---|---|---|
| Open | Young Patricia Ann | $600,500 |
Source: Public Records
Tax History Compared to Growth
Tax History
| Year | Tax Paid | Tax Assessment Tax Assessment Total Assessment is a certain percentage of the fair market value that is determined by local assessors to be the total taxable value of land and additions on the property. | Land | Improvement |
|---|---|---|---|---|
| 2025 | $3,381 | $346,006 | $214,594 | $131,412 |
| 2024 | $3,381 | $339,222 | $210,386 | $128,836 |
| 2023 | $3,308 | $332,571 | $206,261 | $126,310 |
| 2022 | $3,244 | $326,050 | $202,216 | $123,834 |
| 2021 | $3,180 | $319,657 | $198,251 | $121,406 |
| 2020 | $3,148 | $316,380 | $196,218 | $120,162 |
| 2019 | $3,085 | $310,177 | $192,371 | $117,806 |
| 2018 | $3,024 | $304,096 | $188,599 | $115,497 |
| 2017 | $2,964 | $298,134 | $184,901 | $113,233 |
| 2016 | $2,906 | $292,289 | $181,276 | $111,013 |
| 2015 | $2,861 | $287,899 | $178,553 | $109,346 |
| 2014 | $2,804 | $282,260 | $175,055 | $107,205 |
Source: Public Records
Map
Nearby Homes
- 24692 Sutton Ln
- 24471 Los Serranos Dr
- 24565 Camden Ct
- 24561 Los Serranos Dr
- 2 Novilla
- 23821 Hillhurst Dr Unit 16
- 23892 Hillhurst Dr
- 14 Novilla
- 23971 Stillwater Ln
- 28 Mykonos
- 24625 Los Serranos Dr
- 30363 Paseo Del Valle
- 19 Celano
- 30042 Oceanus
- 2 Corsica
- 24822 Cutter
- 16 Pienza
- 17 Siena
- 2 Milos
- 10 Sitges
- 24271 Los Serranos Dr
- 24222 La Hermosa Ave
- 24232 La Hermosa Ave
- 24281 Los Serranos Dr
- 24242 La Hermosa Ave
- 30361 Via Chico Place
- 24202 La Hermosa Ave
- 24291 Los Serranos Dr
- 30365 Via Alcazar Ave
- 24244 La Hermosa Ave
- 24192 La Hermosa Ave
- 24282 Los Serranos Dr
- 24231 La Hermosa Ave
- 30371 Via Chico Place
- 24221 La Hermosa Ave
- 24246 La Hermosa Ave
- 30371 Via Alcazar Ave
- 24301 Los Serranos Dr
- 30242 Benecia Ave
- 24286 Los Serranos Dr