Estimated Value: $569,000 - $604,000
5
Beds
4
Baths
2,293
Sq Ft
$257/Sq Ft
Est. Value
About This Home
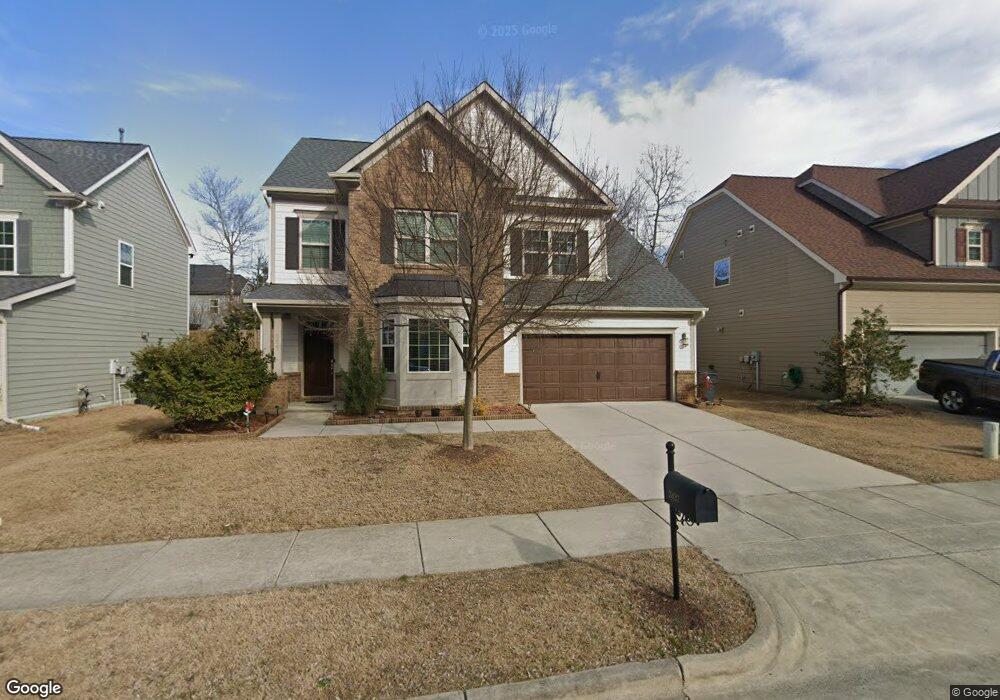
This home is located at 2427 Bingley Ct Unit 187, Apex, NC 27539 and is currently estimated at $590,225, approximately $257 per square foot. 2427 Bingley Ct Unit 187 is a home located in Wake County with nearby schools including Lufkin Road Middle School, Apex Friendship High School, and Pine Springs Prep Academy.
Ownership History
Date
Name
Owned For
Owner Type
Purchase Details
Closed on
Oct 2, 2020
Sold by
Annamalai Gokulamadhavan and Parthasarthy Saranya
Bought by
Ramalingam Muthiah Raja and Muthiah Raja Mohana
Current Estimated Value
Home Financials for this Owner
Home Financials are based on the most recent Mortgage that was taken out on this home.
Original Mortgage
$359,100
Outstanding Balance
$319,400
Interest Rate
2.9%
Mortgage Type
New Conventional
Estimated Equity
$270,825
Purchase Details
Closed on
Mar 17, 2015
Sold by
Ashton Raleigh Residential Llc
Bought by
Annamalai Gokulamadhavan and Parthasarathy Saranya
Home Financials for this Owner
Home Financials are based on the most recent Mortgage that was taken out on this home.
Original Mortgage
$275,000
Interest Rate
2.87%
Mortgage Type
Adjustable Rate Mortgage/ARM
Create a Home Valuation Report for This Property
The Home Valuation Report is an in-depth analysis detailing your home's value as well as a comparison with similar homes in the area
Home Values in the Area
Average Home Value in this Area
Purchase History
| Date | Buyer | Sale Price | Title Company |
|---|---|---|---|
| Ramalingam Muthiah Raja | $378,000 | None Available | |
| Annamalai Gokulamadhavan | $295,500 | None Available |
Source: Public Records
Mortgage History
| Date | Status | Borrower | Loan Amount |
|---|---|---|---|
| Open | Ramalingam Muthiah Raja | $359,100 | |
| Previous Owner | Annamalai Gokulamadhavan | $275,000 |
Source: Public Records
Tax History Compared to Growth
Tax History
| Year | Tax Paid | Tax Assessment Tax Assessment Total Assessment is a certain percentage of the fair market value that is determined by local assessors to be the total taxable value of land and additions on the property. | Land | Improvement |
|---|---|---|---|---|
| 2025 | $4,967 | $566,612 | $130,000 | $436,612 |
| 2024 | $4,856 | $566,612 | $130,000 | $436,612 |
| 2023 | $4,057 | $368,028 | $68,000 | $300,028 |
| 2022 | $3,809 | $368,028 | $68,000 | $300,028 |
| 2021 | $3,663 | $368,028 | $68,000 | $300,028 |
| 2020 | $3,627 | $368,028 | $68,000 | $300,028 |
| 2019 | $3,418 | $299,178 | $68,000 | $231,178 |
| 2018 | $3,219 | $299,178 | $68,000 | $231,178 |
| 2017 | $2,997 | $299,178 | $68,000 | $231,178 |
| 2016 | $2,953 | $299,178 | $68,000 | $231,178 |
| 2015 | $2,424 | $54,000 | $54,000 | $0 |
Source: Public Records
Map
Nearby Homes
- 825 Wickham Ridge Rd
- 5417 Bobbitt Rd
- 680 Wickham Ridge Rd
- 314 Cabana Dr
- 5712 Mosley Ave
- 3340 Colby Chase Dr Unit Lot 2
- 102 Spring Dove Ln
- 3332 Colby Chase Dr Unit Lot 3
- 2340 Horton Park Dr
- 5828 Old Smithfield Rd
- 2273 Horton Park Dr
- 2271 Horton Park Dr
- 2269 Horton Park Dr
- 2267 Horton Park Dr
- 2265 Horton Park Dr
- 2325 Horton Park Dr
- 2332 Horton Park Dr
- 2253 Horton Park Dr
- 2329 Horton Park Dr
- 2341 Horton Park Dr
- 2427 Bingley Ct
- 2423 Bingley Ct
- 2423 Bingley Ct Unit 188
- 2431 Bingley Ct
- 2431 Bingley Ct Unit 186
- 2434 Pilsley Rd
- 2419 Bingley Ct
- 2430 Pilsley Rd
- 2426 Pilsley Rd
- 2438 Pilsley Rd
- 2428 Bingley Ct Unit 201
- 2424 Bingley Ct Unit 200
- 2415 Bingley Ct
- 2420 Bingley Ct Unit 199
- 2420 Bingley Ct
- 2422 Pilsley Rd
- 3813 Colby Chase Dr
- 3813 Colby Chase Dr Unit 184
- 3817 Colby Chase Dr Unit 183
- 3809 Colby Chase Dr