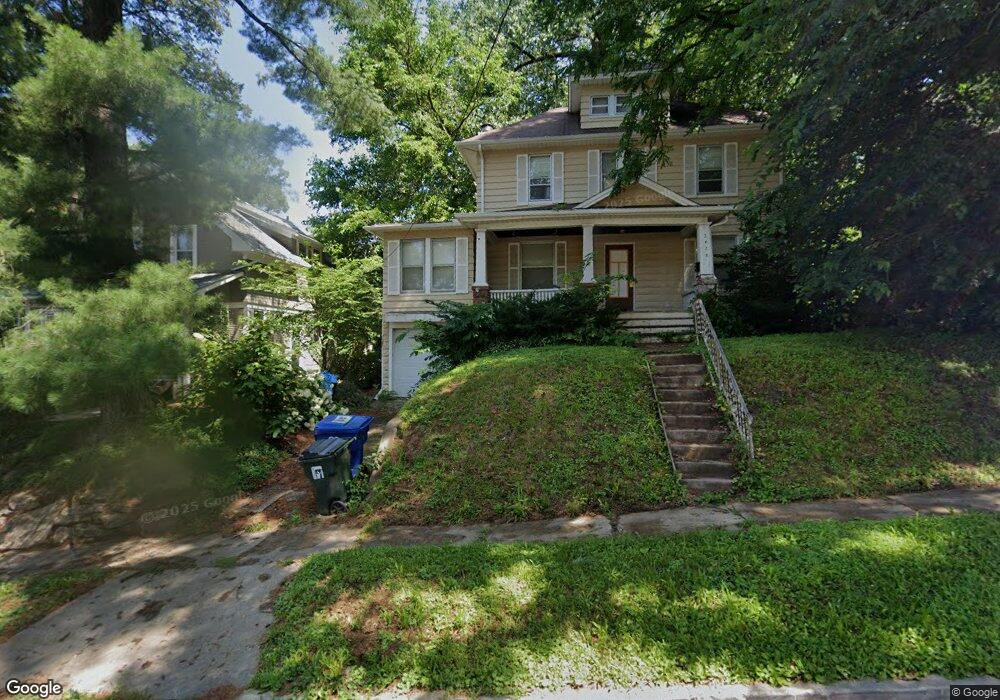
2428 East St Davenport, IA 52803
East End NeighborhoodEstimated Value: $171,828 - $223,000
3
Beds
1
Bath
1,454
Sq Ft
$141/Sq Ft
Est. Value
About This Home
This home is located at 2428 East St, Davenport, IA 52803 and is currently estimated at $204,707, approximately $140 per square foot. 2428 East St is a home located in Scott County with nearby schools including McKinley Elementary School, Casey County Middle School, and Hopkinsville Middle School.
Ownership History
Date
Name
Owned For
Owner Type
Purchase Details
Closed on
May 19, 2011
Sold by
Nelson Megan Renee and Lawrence Megan Renee
Bought by
Lawrence Nathan M
Current Estimated Value
Purchase Details
Closed on
Oct 27, 2005
Sold by
Secretary Of Veteran Affairs
Bought by
Lawrence Nathan M
Home Financials for this Owner
Home Financials are based on the most recent Mortgage that was taken out on this home.
Original Mortgage
$81,600
Outstanding Balance
$44,798
Interest Rate
6.17%
Mortgage Type
New Conventional
Estimated Equity
$159,909
Purchase Details
Closed on
May 31, 2005
Sold by
Mortgage Electronic Registration Inc
Bought by
Secretary Of Veterans Affairs
Purchase Details
Closed on
May 4, 2005
Sold by
Hill Rocky W
Bought by
Mortgage Electronic Registration Systems
Create a Home Valuation Report for This Property
The Home Valuation Report is an in-depth analysis detailing your home's value as well as a comparison with similar homes in the area
Home Values in the Area
Average Home Value in this Area
Purchase History
| Date | Buyer | Sale Price | Title Company |
|---|---|---|---|
| Lawrence Nathan M | -- | None Available | |
| Lawrence Nathan M | -- | None Available | |
| Secretary Of Veterans Affairs | $99,500 | None Available | |
| Mortgage Electronic Registration Systems | $99,147 | None Available |
Source: Public Records
Mortgage History
| Date | Status | Borrower | Loan Amount |
|---|---|---|---|
| Open | Lawrence Nathan M | $81,600 |
Source: Public Records
Tax History Compared to Growth
Tax History
| Year | Tax Paid | Tax Assessment Tax Assessment Total Assessment is a certain percentage of the fair market value that is determined by local assessors to be the total taxable value of land and additions on the property. | Land | Improvement |
|---|---|---|---|---|
| 2025 | $2,480 | $183,180 | $34,130 | $149,050 |
| 2024 | $2,236 | $138,760 | $34,130 | $104,630 |
| 2023 | $2,332 | $128,250 | $34,130 | $94,120 |
| 2022 | $2,264 | $109,160 | $32,810 | $76,350 |
| 2021 | $2,264 | $105,530 | $32,810 | $72,720 |
| 2020 | $2,292 | $105,530 | $32,810 | $72,720 |
| 2019 | $2,300 | $102,500 | $32,810 | $69,690 |
| 2018 | $0 | $102,500 | $32,810 | $69,690 |
| 2017 | $553 | $99,470 | $32,810 | $66,660 |
| 2016 | $2,834 | $129,440 | $0 | $0 |
| 2015 | $2,834 | $128,970 | $0 | $0 |
| 2014 | $2,864 | $128,970 | $0 | $0 |
| 2013 | $2,814 | $0 | $0 | $0 |
| 2012 | -- | $123,900 | $35,230 | $88,670 |
Source: Public Records
Map
Nearby Homes
- 1515 Jersey Ridge Rd
- 1704 Jersey Ridge Rd
- 2316 East St
- 1734 Ridgewood Ave
- 1803 Belle Ave
- 1815 Belle Ave
- 1504 Christie St
- 10 Kenwood Ave
- 1 Kenwood Ave
- 2316 E Pleasant St
- 19 Kenwood Ave
- 2810 Middle Rd
- 2811 E 18th St
- 2704 E High St
- 2131 Lorton Ave
- 2618 Elm St
- 2905 Middle Rd
- 2103 E Lombard St
- 9 Parkwood Dr
- 1233 Eastern Ave
- 2422 East St
- 2432 East St
- 2506 East St
- 2412 East St
- 1709 Jersey Ridge Rd
- 1703 Jersey Ridge Rd
- 2512 East St
- 1715 Jersey Ridge Rd
- 1719 Jersey Ridge Rd
- 1725 Jersey Ridge Rd
- 2516 East St
- 1607 Jersey Ridge Rd
- 2501 East St
- 748 Ridgewood Ave
- 2505 East St
- 1714 Ridgewood Ave
- 1710 Ridgewood Ave
- 1729 Jersey Ridge Rd
- 2509 East St
- 1718 Ridgewood Ave