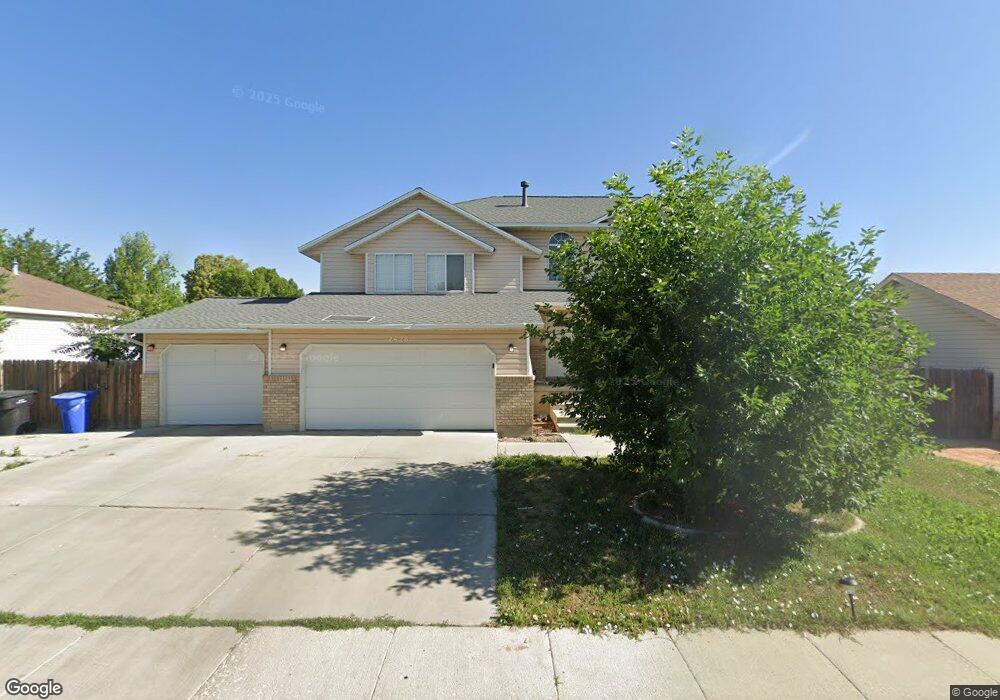
2428 W Sugar Place West Jordan, UT 84088
Estimated Value: $614,000 - $778,000
4
Beds
3
Baths
2,484
Sq Ft
$266/Sq Ft
Est. Value
About This Home
This home is located at 2428 W Sugar Place, West Jordan, UT 84088 and is currently estimated at $659,608, approximately $265 per square foot. 2428 W Sugar Place is a home located in Salt Lake County with nearby schools including Westvale Elementary School, West Jordan Middle School, and West Jordan High School.
Ownership History
Date
Name
Owned For
Owner Type
Purchase Details
Closed on
Mar 29, 2022
Sold by
Scott Hughes Todd
Bought by
Progress Salt Lake City Llc
Current Estimated Value
Purchase Details
Closed on
Mar 25, 2022
Sold by
Scott Hughes Todd
Bought by
Progress Salt Lake City Llc
Purchase Details
Closed on
Aug 31, 2010
Sold by
Schaffnit Richard W and Chavez Heather A
Bought by
Hughes Todd Scott
Home Financials for this Owner
Home Financials are based on the most recent Mortgage that was taken out on this home.
Original Mortgage
$141,000
Interest Rate
4.51%
Mortgage Type
New Conventional
Purchase Details
Closed on
Jun 30, 1998
Sold by
Schlesinger Philip John and Schlesinger Kathleen T
Bought by
Schaffnit Richard W and Chavez Heather A
Home Financials for this Owner
Home Financials are based on the most recent Mortgage that was taken out on this home.
Original Mortgage
$122,000
Interest Rate
7.06%
Create a Home Valuation Report for This Property
The Home Valuation Report is an in-depth analysis detailing your home's value as well as a comparison with similar homes in the area
Home Values in the Area
Average Home Value in this Area
Purchase History
| Date | Buyer | Sale Price | Title Company |
|---|---|---|---|
| Progress Salt Lake City Llc | -- | New Title Company Name | |
| Progress Salt Lake City Llc | -- | New Title Company Name | |
| Hughes Todd Scott | -- | Morgan Title & Escrow | |
| Schaffnit Richard W | -- | -- |
Source: Public Records
Mortgage History
| Date | Status | Borrower | Loan Amount |
|---|---|---|---|
| Previous Owner | Hughes Todd Scott | $141,000 | |
| Previous Owner | Schaffnit Richard W | $122,000 |
Source: Public Records
Tax History Compared to Growth
Tax History
| Year | Tax Paid | Tax Assessment Tax Assessment Total Assessment is a certain percentage of the fair market value that is determined by local assessors to be the total taxable value of land and additions on the property. | Land | Improvement |
|---|---|---|---|---|
| 2025 | $2,786 | $580,100 | $181,700 | $398,400 |
| 2024 | $2,786 | $536,100 | $167,600 | $368,500 |
| 2023 | $2,824 | $512,000 | $158,100 | $353,900 |
| 2022 | $2,933 | $523,200 | $155,000 | $368,200 |
| 2021 | $2,484 | $403,400 | $125,000 | $278,400 |
| 2020 | $2,351 | $358,300 | $125,000 | $233,300 |
| 2019 | $2,259 | $337,600 | $125,000 | $212,600 |
| 2018 | $2,125 | $315,000 | $91,700 | $223,300 |
| 2017 | $2,002 | $295,400 | $91,700 | $203,700 |
| 2016 | $1,967 | $272,800 | $91,700 | $181,100 |
| 2015 | $1,778 | $240,400 | $96,000 | $144,400 |
| 2014 | $1,648 | $219,300 | $89,000 | $130,300 |
Source: Public Records
Map
Nearby Homes
- 2497 Bueno Vista Dr
- 8026 Laguna Cir
- 8140 S 2245 W
- 48 San Rafael Ct
- 7968 S 2700 W
- 14 San Miguel St
- 7993 S 2760 W
- 77 Rio Bravo Place
- 8461 S 2385 W
- 8383 S 2200 W
- 7942 S 2800 W
- 7987 S 2980 W
- 2386 W 7680 S
- 7647 S 2500 W
- 8407 Meadow Green Way
- 4000 W 8400 S Unit 83
- 1790 W Sugar Factory Rd
- 2062 W 7705 S
- 7721 Sunset Cir
- 3066 W Linton Dr
- 2428 Sugar Place
- 2412 Sugar Place
- 2444 Sugar Place
- 2412 W Sugar Place
- 2485 Bueno Vista Dr
- 2485 W Bueno Vista Dr
- 2423 Sugar Place
- 2398 Sugar Place
- 2460 Sugar Place
- 2433 Sugar Place
- 2413 Sugar Place
- 2413 W Sugar Place
- 2471 Bueno Vista Dr
- 2471 W Bueno Vista Dr
- 2445 W Sugar Place
- 2445 Sugar Place
- 2403 Sugar Place
- 2403 W Sugar Place
- 2511 Bueno Vista Dr
- 2457 Sugar Place Dr