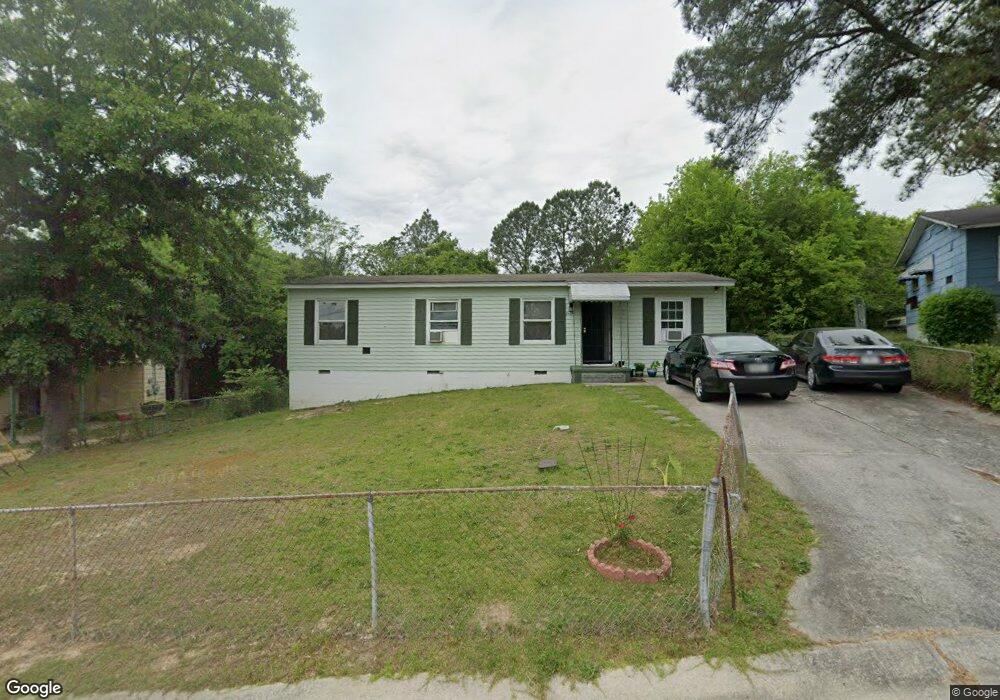
2429 Anthony Cir Macon, GA 31206
Estimated Value: $59,000 - $68,000
3
Beds
1
Bath
1,012
Sq Ft
$64/Sq Ft
Est. Value
About This Home
This home is located at 2429 Anthony Cir, Macon, GA 31206 and is currently estimated at $64,461, approximately $63 per square foot. 2429 Anthony Cir is a home located in Bibb County with nearby schools including Hartley Elementary School, Southwest High School, and Cirrus Charter Academy.
Ownership History
Date
Name
Owned For
Owner Type
Purchase Details
Closed on
May 4, 2011
Sold by
Coleman Properties Inc
Bought by
French Naomi T
Current Estimated Value
Purchase Details
Closed on
May 3, 2011
Sold by
Warthen Justin
Bought by
Coleman Properties Inc & Clay Bowie
Purchase Details
Closed on
Dec 13, 2010
Sold by
Coleman Properties Inc
Bought by
Warthen Justin
Home Financials for this Owner
Home Financials are based on the most recent Mortgage that was taken out on this home.
Original Mortgage
$30,000
Interest Rate
4.32%
Mortgage Type
Seller Take Back
Purchase Details
Closed on
Apr 30, 2010
Sold by
Scott Mary C
Bought by
Coleman Properties Inc
Home Financials for this Owner
Home Financials are based on the most recent Mortgage that was taken out on this home.
Original Mortgage
$6,138
Interest Rate
4.2%
Mortgage Type
Unknown
Create a Home Valuation Report for This Property
The Home Valuation Report is an in-depth analysis detailing your home's value as well as a comparison with similar homes in the area
Purchase History
| Date | Buyer | Sale Price | Title Company |
|---|---|---|---|
| French Naomi T | $30,926 | None Available | |
| Coleman Properties Inc & Clay Bowie | $30,000 | None Available | |
| Warthen Justin | $35,000 | None Available | |
| Coleman Properties Inc | $12,000 | None Available |
Source: Public Records
Mortgage History
| Date | Status | Borrower | Loan Amount |
|---|---|---|---|
| Previous Owner | Warthen Justin | $30,000 | |
| Previous Owner | Coleman Properties Inc | $6,138 |
Source: Public Records
Tax History
| Year | Tax Paid | Tax Assessment Tax Assessment Total Assessment is a certain percentage of the fair market value that is determined by local assessors to be the total taxable value of land and additions on the property. | Land | Improvement |
|---|---|---|---|---|
| 2025 | $483 | $19,639 | $1,500 | $18,139 |
| 2024 | $499 | $19,639 | $1,500 | $18,139 |
| 2023 | $499 | $19,639 | $1,500 | $18,139 |
| 2022 | $417 | $12,051 | $3,014 | $9,037 |
| 2021 | $458 | $12,051 | $3,014 | $9,037 |
| 2020 | $468 | $12,051 | $3,014 | $9,037 |
| 2019 | $472 | $12,051 | $3,014 | $9,037 |
| 2018 | $902 | $12,051 | $3,014 | $9,037 |
| 2017 | $452 | $12,051 | $3,014 | $9,037 |
| 2016 | $417 | $12,052 | $3,014 | $9,037 |
| 2015 | $590 | $12,052 | $3,014 | $9,037 |
| 2014 | $679 | $12,052 | $3,014 | $9,037 |
Source: Public Records
Map
Nearby Homes
- 1545 Anthony Rd
- 1323 Crawford St
- 815 Edwards Ave
- 742 Grayson Ave
- 2509 Kent Dr
- 730 Grayson Ave
- 2125 Cedar Ave
- 800 Patton Ave
- 2445 Adams Ave
- 210 Moseley Ave
- 2420 Adams Ave
- 670 Poppy Ave
- 736 Key St
- 660 Lilly Ave
- 2106 Mason St
- 1801 Winston Dr
- 1144 Carroll St
- 1792 Winston Dr
- 1121 Carroll St
- 576 Pansy Ave
- 2435 Anthony Cir
- 2423 Anthony Cir
- 2428 Anthony Cir
- 2417 Anthony Cir
- 2441 Anthony Cir
- 2434 Anthony Cir
- 2440 Anthony Cir
- 2407 Anthony Terrace
- 2447 Anthony Cir
- 2415 Anthony Terrace
- 2411 Anthony Cir Unit 1
- 2411 Anthony Cir
- 2405 Anthony Cir
- 2446 Anthony Cir
- 2425 Anthony Terrace
- 2353 Anthony Terrace
- 2453 Anthony Cir
- 2433 Anthony Terrace
- 2454 Anthony Cir
- 2410 Anthony Terrace
Your Personal Tour Guide
Ask me questions while you tour the home.