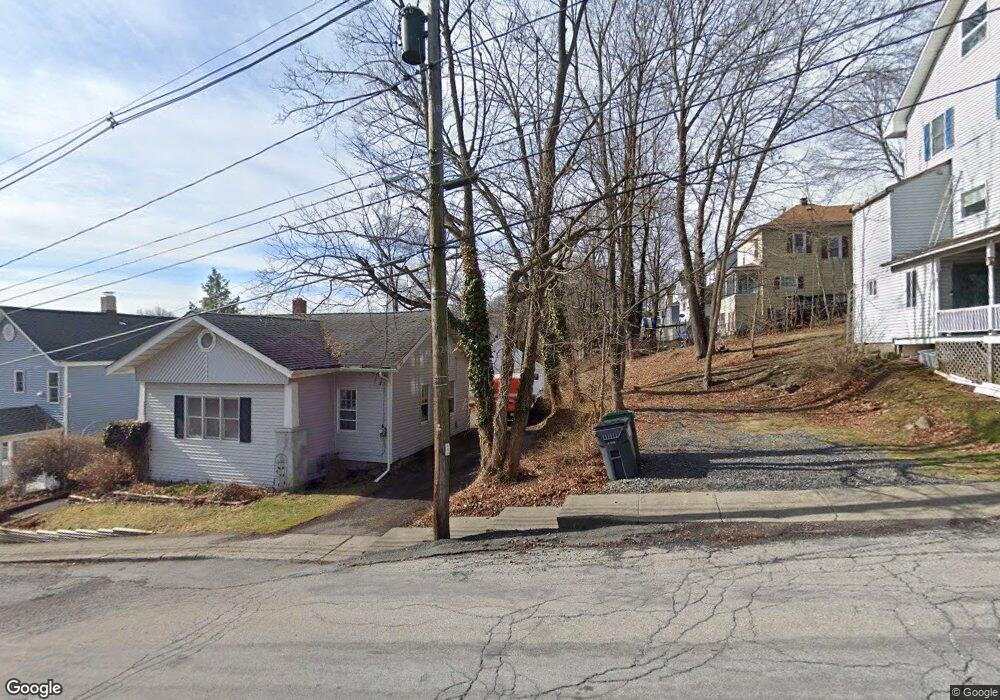
243 Broadway Maybrook, NY 12543
Estimated Value: $257,848
Studio
--
Bath
2,250
Sq Ft
$115/Sq Ft
Est. Value
About This Home
This home is located at 243 Broadway, Maybrook, NY 12543 and is currently estimated at $257,848, approximately $114 per square foot. 243 Broadway is a home with nearby schools including Newburgh Free Academy Main Campus, Bishop Dunn Memorial, and San Miguel Academy Of Newburgh.
Ownership History
Date
Name
Owned For
Owner Type
Purchase Details
Closed on
Oct 18, 2021
Sold by
Hernandez Martin
Bought by
Hernandez Martin and Hernandez Emilia
Current Estimated Value
Purchase Details
Closed on
Nov 25, 2002
Sold by
Martinez Jose F and Martinez Juanita
Bought by
Hernandez Policarpio
Purchase Details
Closed on
Mar 30, 2001
Sold by
Patino Yolanda D and Capital Builders & Properties
Bought by
Cityscape Home Equity Loan Trust 1997-B
Create a Home Valuation Report for This Property
The Home Valuation Report is an in-depth analysis detailing your home's value as well as a comparison with similar homes in the area
Home Values in the Area
Average Home Value in this Area
Purchase History
| Date | Buyer | Sale Price | Title Company |
|---|---|---|---|
| Hernandez Martin | -- | None Available | |
| Hernandez Martin | -- | None Available | |
| Hernandez Martin | -- | None Available | |
| Hernandez Policarpio | $105,000 | Fidelity National Title Ins | |
| Hernandez Policarpio | $105,000 | Fidelity National Title Ins | |
| Cityscape Home Equity Loan Trust 1997-B | $62,843 | -- | |
| Cityscape Home Equity Loan Trust 1997-B | $62,843 | -- |
Source: Public Records
Tax History
| Year | Tax Paid | Tax Assessment Tax Assessment Total Assessment is a certain percentage of the fair market value that is determined by local assessors to be the total taxable value of land and additions on the property. | Land | Improvement |
|---|---|---|---|---|
| 2024 | $7,073 | $214,000 | $39,200 | $174,800 |
| 2023 | $7,073 | $214,000 | $39,200 | $174,800 |
| 2022 | $7,230 | $169,200 | $12,500 | $156,700 |
| 2021 | $7,893 | $169,200 | $12,500 | $156,700 |
| 2020 | $8,211 | $169,200 | $12,500 | $156,700 |
| 2019 | $4,299 | $140,400 | $12,500 | $127,900 |
| 2018 | $4,299 | $140,400 | $15,000 | $125,400 |
| 2017 | $7,125 | $140,400 | $15,000 | $125,400 |
| 2016 | $7,578 | $133,100 | $15,000 | $118,100 |
| 2015 | -- | $133,100 | $15,000 | $118,100 |
| 2014 | -- | $133,100 | $15,000 | $118,100 |
Source: Public Records
Map
Nearby Homes
- 211 Broadway
- 204 Ann St
- 202 Ann St
- 74 Van Ness St
- 35 Carpenter Ave
- 48 Lutheran St
- 114 W Parmenter St
- 112 W Parmenter St
- 46 Hasbrouck St
- 1 Bolger Ct
- 280 1st St
- 201 W Parmenter St
- 157 Broadway
- 150-156 Broadway
- 63 S Robinson Ave
- 85 City Terrace
- 86 William St
- 204 S William St
- 145 Washington St
- 3 Bolger Ct
Your Personal Tour Guide
Ask me questions while you tour the home.