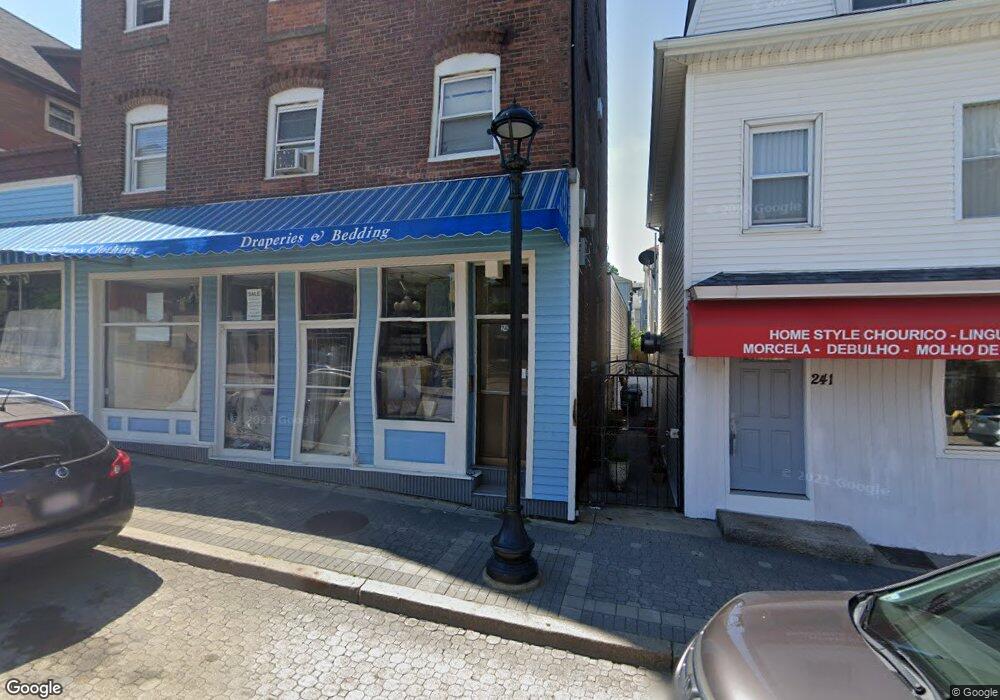
243 Columbia St Fall River, MA 02721
Sandy Beach NeighborhoodEstimated Value: $911,847
10
Beds
5
Baths
10,640
Sq Ft
$86/Sq Ft
Est. Value
About This Home
This home is located at 243 Columbia St, Fall River, MA 02721 and is currently estimated at $911,847, approximately $85 per square foot. 243 Columbia St is a home located in Bristol County with nearby schools including John J. Doran Community School, Matthew J. Kuss Middle School, and B M C Durfee High School.
Ownership History
Date
Name
Owned For
Owner Type
Purchase Details
Closed on
Jun 30, 2021
Sold by
Carol A Braga Nt and Branga
Bought by
243-245 Columbia Llc
Current Estimated Value
Home Financials for this Owner
Home Financials are based on the most recent Mortgage that was taken out on this home.
Original Mortgage
$525,000
Outstanding Balance
$473,247
Interest Rate
2.9%
Mortgage Type
Purchase Money Mortgage
Estimated Equity
$438,600
Purchase Details
Closed on
Sep 3, 2010
Sold by
Carol A Braga Ret and Braga
Bought by
Carol A Braga T A and Carol Braga
Purchase Details
Closed on
Jul 29, 1992
Sold by
Braga Manuel
Bought by
Braga Carol Ann
Home Financials for this Owner
Home Financials are based on the most recent Mortgage that was taken out on this home.
Original Mortgage
$50,000
Interest Rate
8.46%
Mortgage Type
Commercial
Create a Home Valuation Report for This Property
The Home Valuation Report is an in-depth analysis detailing your home's value as well as a comparison with similar homes in the area
Home Values in the Area
Average Home Value in this Area
Purchase History
| Date | Buyer | Sale Price | Title Company |
|---|---|---|---|
| 243-245 Columbia Llc | $700,000 | None Available | |
| 243-245 Columbia Llc | $700,000 | None Available | |
| 243-245 Columbia Llc | $700,000 | None Available | |
| Carol A Braga T A | -- | -- | |
| Carol A Braga T A | -- | -- | |
| Braga Carol Ann | $50,000 | -- | |
| Braga Carol Ann | $50,000 | -- |
Source: Public Records
Mortgage History
| Date | Status | Borrower | Loan Amount |
|---|---|---|---|
| Open | 243-245 Columbia Llc | $525,000 | |
| Closed | 243-245 Columbia Llc | $525,000 | |
| Previous Owner | Braga Carol Ann | $50,000 |
Source: Public Records
Tax History
| Year | Tax Paid | Tax Assessment Tax Assessment Total Assessment is a certain percentage of the fair market value that is determined by local assessors to be the total taxable value of land and additions on the property. | Land | Improvement |
|---|---|---|---|---|
| 2025 | $16,004 | $687,600 | $138,100 | $549,500 |
| 2024 | $16,004 | $668,500 | $131,500 | $537,000 |
| 2023 | $0 | $611,100 | $119,400 | $491,700 |
| 2022 | $0 | $533,500 | $119,400 | $414,100 |
| 2021 | $0 | $525,600 | $117,700 | $407,900 |
| 2020 | $12,976 | $519,600 | $123,100 | $396,500 |
| 2019 | $12,696 | $508,700 | $123,100 | $385,600 |
| 2018 | $0 | $496,500 | $123,100 | $373,400 |
| 2017 | -- | $496,500 | $123,100 | $373,400 |
| 2016 | -- | $496,500 | $123,100 | $373,400 |
| 2015 | -- | $497,100 | $123,100 | $374,000 |
| 2014 | -- | $497,100 | $123,100 | $374,000 |
Source: Public Records
Map
Nearby Homes
- 75 Hunter St
- 77 Hunter St
- 79 Hunter St
- 302 Hope St
- 81 Hunter St
- 337 Columbia St
- 271 Mulberry St
- 165 Grant St
- 169 Grant St
- 452 S Main St
- 330 William St
- 327 William St
- 48 Ridge St
- 315 William St
- 334 Fountain St
- 640 S Main St
- 403 Division St Unit 13
- 403 Division St Unit 5
- 403 Division St Unit 9
- 403 Division St Unit 11
- 243 Columbia St Unit 2
- 243 Columbia St Unit 4
- 243 Columbia St Unit 3
- 20 Grant St
- 370 Hope St
- 32 Grant St
- 257 Columbia St
- 255 Columbia St
- 255 Columbia St Unit STT
- 255 Columbia St Unit 2
- 255 Columbia St Unit 3
- 255 Columbia St
- 235 Columbia St
- 374 Hope St Unit 3S
- 46 Grant St
- 225 Columbia St Unit 2
- 19 Grant St
- 215 Columbia St
- 353 Hope St
- 351 Hope St
Your Personal Tour Guide
Ask me questions while you tour the home.