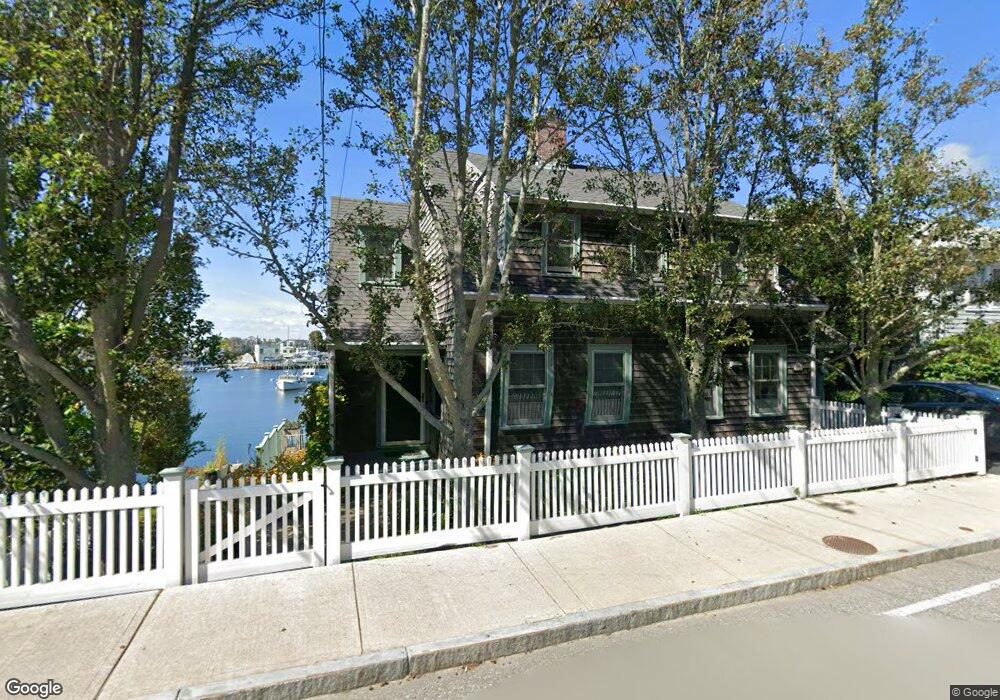
243 E Main St Gloucester, MA 01930
East Gloucester NeighborhoodEstimated Value: $1,104,000 - $1,786,000
3
Beds
2
Baths
1,664
Sq Ft
$897/Sq Ft
Est. Value
About This Home
This home is located at 243 E Main St, Gloucester, MA 01930 and is currently estimated at $1,492,867, approximately $897 per square foot. 243 E Main St is a home located in Essex County with nearby schools including East Gloucester Elementary School, Ralph B O'maley Middle School, and Gloucester High School.
Ownership History
Date
Name
Owned For
Owner Type
Purchase Details
Closed on
Mar 15, 2013
Sold by
Campbell Andrew
Bought by
243 E Main Street T
Current Estimated Value
Purchase Details
Closed on
Mar 31, 1992
Sold by
Ryczek George W
Bought by
Campbell Andrew
Create a Home Valuation Report for This Property
The Home Valuation Report is an in-depth analysis detailing your home's value as well as a comparison with similar homes in the area
Home Values in the Area
Average Home Value in this Area
Purchase History
| Date | Buyer | Sale Price | Title Company |
|---|---|---|---|
| 243 E Main Street T | -- | -- | |
| Campbell Andrew | $300,000 | -- |
Source: Public Records
Mortgage History
| Date | Status | Borrower | Loan Amount |
|---|---|---|---|
| Previous Owner | Campbell Andrew | $400,000 | |
| Previous Owner | Campbell Andrew | $100,000 | |
| Previous Owner | Campbell Andrew | $200,000 | |
| Previous Owner | Campbell Andrew | $280,800 |
Source: Public Records
Tax History
| Year | Tax Paid | Tax Assessment Tax Assessment Total Assessment is a certain percentage of the fair market value that is determined by local assessors to be the total taxable value of land and additions on the property. | Land | Improvement |
|---|---|---|---|---|
| 2025 | $15,172 | $1,560,900 | $1,071,800 | $489,100 |
| 2024 | $14,683 | $1,509,000 | $1,019,900 | $489,100 |
| 2023 | $13,750 | $1,298,400 | $871,000 | $427,400 |
| 2022 | $13,271 | $1,131,400 | $756,900 | $374,500 |
| 2021 | $12,802 | $1,029,100 | $688,100 | $341,000 |
| 2020 | $12,644 | $1,025,500 | $688,100 | $337,400 |
| 2019 | $12,130 | $955,900 | $656,100 | $299,800 |
| 2018 | $11,808 | $913,200 | $640,100 | $273,100 |
| 2017 | $11,458 | $868,700 | $609,700 | $259,000 |
| 2016 | $11,045 | $811,500 | $583,000 | $228,500 |
| 2015 | $10,659 | $780,900 | $569,800 | $211,100 |
Source: Public Records
Map
Nearby Homes
- 73 Rocky Neck Ave Unit 2
- 60 Rocky Neck Ave Unit 202
- 197 E Main St Unit 1
- 1 Wonson St
- 15 Raven Ln Unit 15
- 10 Seaview Rd
- 191 Main St Unit 3
- 191 Main St Unit 2A
- 139A Prospect St
- 35 Middle St Unit 4
- 11 Ocean View Dr
- 33 Middle St
- 3 Mondello Square
- 15 Mount Vernon St
- 36 Eastern Ave
- 113 Pleasant St
- 50 Warner St
- 5 Wise Place
- 33 Maplewood Ave Unit 310
- 87 Atlantic Rd Unit 2
- 239 E Main St
- 239 E Main St Unit 1
- 239 E Main St
- 237 E Main St
- 212 E Main St
- 245 E Main St
- 220 E Main St
- 233 E Main St
- 247 E Main St
- 226 E Main St
- 249 E Main St
- 249 E Main St Unit 2
- 125 Mount Pleasant Ave
- 251 E Main St
- 228 E Main St
- 253 E Main St
- 4 Gerring Rd
- 230 E Main St
- 255 E Main St
- 121 Mount Pleasant Ave
Your Personal Tour Guide
Ask me questions while you tour the home.