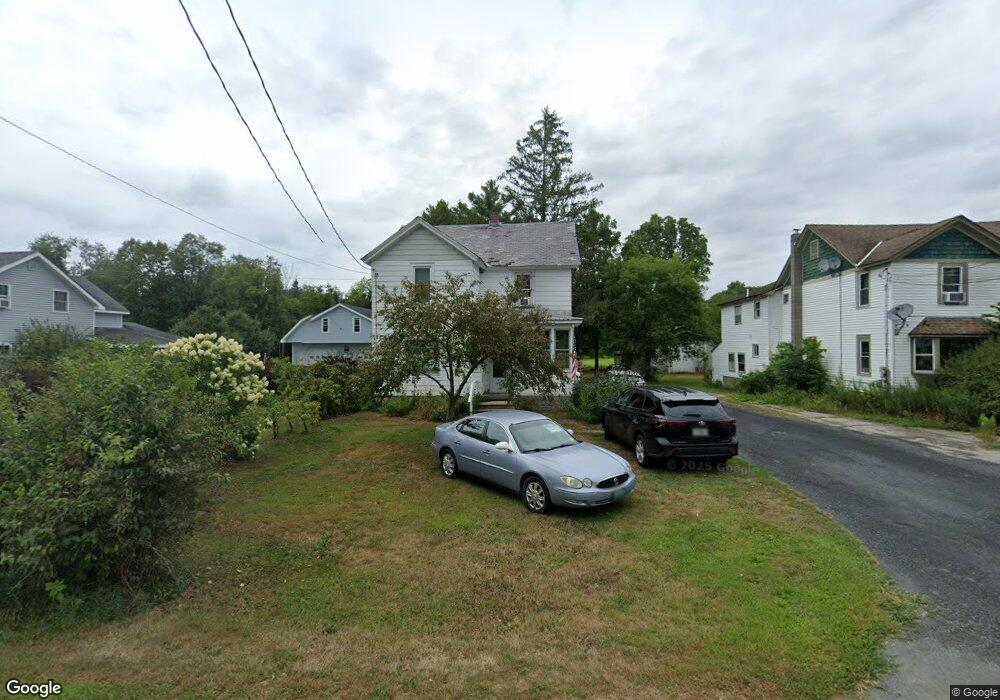
243 E Main St Poultney, VT 05764
Estimated Value: $163,865 - $214,000
3
Beds
1
Bath
1,378
Sq Ft
$131/Sq Ft
Est. Value
About This Home
This home is located at 243 E Main St, Poultney, VT 05764 and is currently estimated at $180,716, approximately $131 per square foot. 243 E Main St is a home located in Rutland County with nearby schools including Poultney Elementary School, Poultney High School, and Lihigh School.
Ownership History
Date
Name
Owned For
Owner Type
Purchase Details
Closed on
May 13, 2025
Sold by
Willard Rodney
Bought by
Baker Mcnally Marcia and Willard Rodney A
Current Estimated Value
Purchase Details
Closed on
Jun 17, 2022
Sold by
Baker-Mcnally Marcia and Mcnally Walter E
Bought by
Willard Rodney A
Purchase Details
Closed on
Mar 20, 2014
Sold by
Willard Rodney A and Willard Bette
Bought by
Mcnally Walter E and Baker Mcnally Marcia
Purchase Details
Closed on
Aug 22, 2007
Sold by
Skovira Joan
Bought by
Haviland Erin E and Willard Rodney A
Create a Home Valuation Report for This Property
The Home Valuation Report is an in-depth analysis detailing your home's value as well as a comparison with similar homes in the area
Home Values in the Area
Average Home Value in this Area
Purchase History
| Date | Buyer | Sale Price | Title Company |
|---|---|---|---|
| Baker Mcnally Marcia | -- | -- | |
| Willard Rodney A | $130,000 | -- | |
| Willard Rodney A | $130,000 | -- | |
| Mcnally Walter E | $98,000 | -- | |
| Haviland Erin E | $108,900 | -- |
Source: Public Records
Tax History
| Year | Tax Paid | Tax Assessment Tax Assessment Total Assessment is a certain percentage of the fair market value that is determined by local assessors to be the total taxable value of land and additions on the property. | Land | Improvement |
|---|---|---|---|---|
| 2024 | $2,059 | $93,800 | $11,500 | $82,300 |
| 2023 | $1,771 | $93,800 | $11,500 | $82,300 |
| 2022 | $1,851 | $93,800 | $11,500 | $82,300 |
| 2021 | $1,900 | $93,800 | $11,500 | $82,300 |
| 2020 | $1,895 | $93,800 | $11,500 | $82,300 |
| 2019 | $1,354 | $93,800 | $11,500 | $82,300 |
| 2018 | $1,655 | $93,800 | $11,500 | $82,300 |
| 2017 | $1,744 | $93,800 | $11,500 | $82,300 |
| 2016 | $1,770 | $93,800 | $11,500 | $82,300 |
| 2015 | -- | $938 | $0 | $0 |
| 2014 | -- | $938 | $0 | $0 |
| 2013 | -- | $938 | $0 | $0 |
Source: Public Records
Map
Nearby Homes
- 129 Grove St
- 68 Church St
- 304 Main St
- 328 Main St
- 321 Bentley Ave
- 900 E Main St
- 1100 E Main St
- 44 Greenfield Ln
- 416 Upper Rd
- L40 Rainbow Way
- 84 Ruby Rd
- 271 Hickey Rd
- 20 Hampton Heights Way
- L1 County Route 18 Off
- 809 Gorhamtown Rd
- 288 Walker Rd
- 1926 W Lake Rd
- 121 Quivey Hill Rd
- 4 Raceville Rd
- 140 County Road 21
Your Personal Tour Guide
Ask me questions while you tour the home.