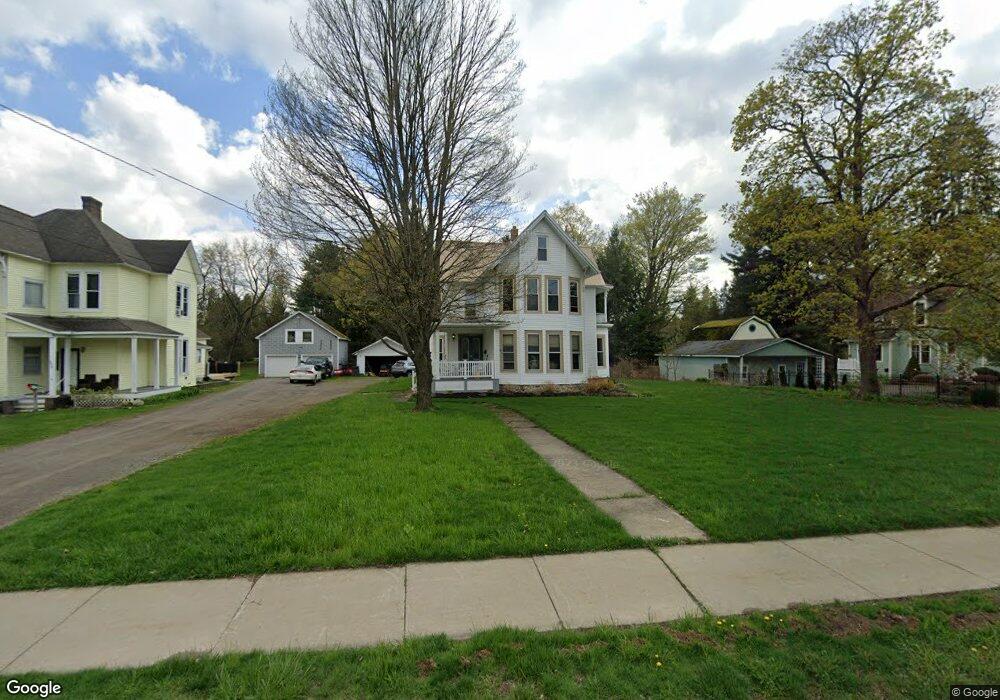
243 E Main St Springville, NY 14141
Estimated Value: $299,329 - $346,000
5
Beds
2
Baths
2,890
Sq Ft
$111/Sq Ft
Est. Value
About This Home
This home is located at 243 E Main St, Springville, NY 14141 and is currently estimated at $321,332, approximately $111 per square foot. 243 E Main St is a home located in Erie County with nearby schools including Springville Elementary School, Griffith Institute Middle School, and Springville High School.
Ownership History
Date
Name
Owned For
Owner Type
Purchase Details
Closed on
Oct 10, 2006
Sold by
Benson Michael A
Bought by
Marlin James R and Marlin Christine L
Current Estimated Value
Home Financials for this Owner
Home Financials are based on the most recent Mortgage that was taken out on this home.
Original Mortgage
$60,000
Outstanding Balance
$35,863
Interest Rate
6.49%
Mortgage Type
Purchase Money Mortgage
Estimated Equity
$285,469
Purchase Details
Closed on
Apr 19, 2004
Sold by
Benson S Arthur L
Bought by
Benson Michael A
Create a Home Valuation Report for This Property
The Home Valuation Report is an in-depth analysis detailing your home's value as well as a comparison with similar homes in the area
Home Values in the Area
Average Home Value in this Area
Purchase History
| Date | Buyer | Sale Price | Title Company |
|---|---|---|---|
| Marlin James R | $120,000 | None Available | |
| Benson Michael A | -- | -- |
Source: Public Records
Mortgage History
| Date | Status | Borrower | Loan Amount |
|---|---|---|---|
| Open | Marlin James R | $60,000 |
Source: Public Records
Tax History
| Year | Tax Paid | Tax Assessment Tax Assessment Total Assessment is a certain percentage of the fair market value that is determined by local assessors to be the total taxable value of land and additions on the property. | Land | Improvement |
|---|---|---|---|---|
| 2024 | $4,442 | $69,900 | $7,900 | $62,000 |
| 2023 | $4,363 | $69,900 | $7,900 | $62,000 |
| 2022 | $4,332 | $69,900 | $7,900 | $62,000 |
| 2021 | $4,315 | $69,900 | $7,900 | $62,000 |
| 2020 | $4,388 | $69,900 | $7,900 | $62,000 |
| 2019 | $3,226 | $69,900 | $7,900 | $62,000 |
| 2018 | $4,674 | $69,900 | $7,900 | $62,000 |
| 2017 | $1,037 | $69,900 | $7,900 | $62,000 |
| 2016 | $4,396 | $69,900 | $7,900 | $62,000 |
| 2015 | -- | $69,900 | $7,900 | $62,000 |
| 2014 | -- | $69,900 | $7,900 | $62,000 |
Source: Public Records
Map
Nearby Homes
- 101 Pearl St
- 36 Mill St
- 14 W Main St
- 26 W Main St
- 193 Franklin St
- 13 E Hill Run
- 82 N Central Ave
- 14 E Hill Run
- 227 Mill St
- 8944 North St
- 159 E Hill Run
- 165 E Hill Run
- 192 Woodward Ave
- 6 Vaughn St
- 13170 Transit Line Rd
- 6610 Thomas Corners Rd
- 6558 Thomas Corners Rd
- 0 Emerson Rd
- 10300 Route 39
- 0 Beech Tree Rd Unit B1653186
Your Personal Tour Guide
Ask me questions while you tour the home.