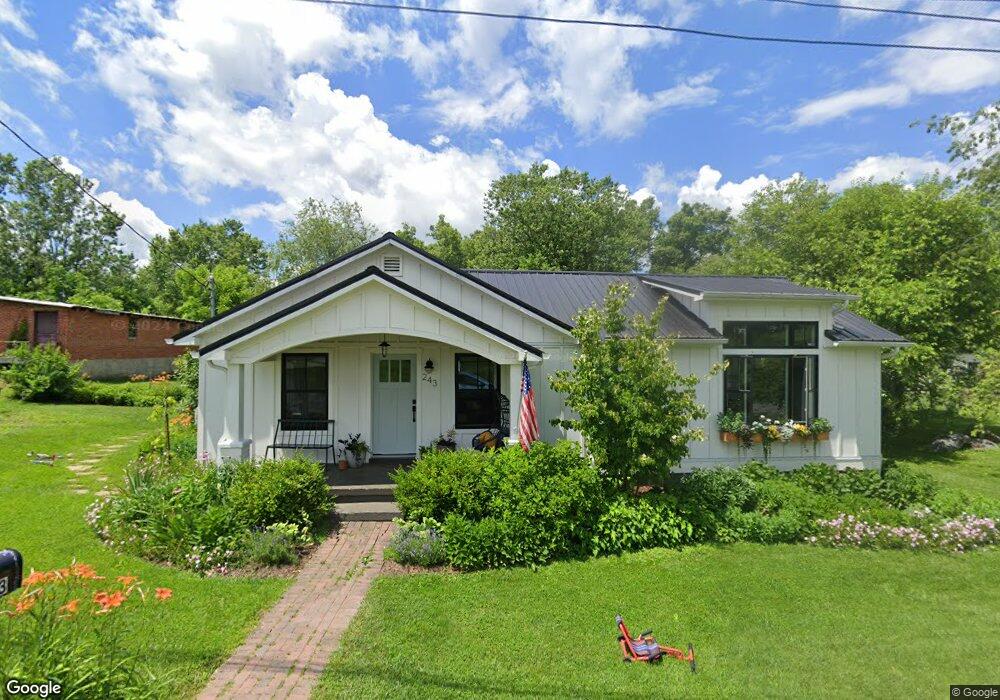
243 Fugate St SW Abingdon, VA 24210
Estimated Value: $186,000 - $268,000
2
Beds
1
Bath
1,104
Sq Ft
$211/Sq Ft
Est. Value
About This Home
This home is located at 243 Fugate St SW, Abingdon, VA 24210 and is currently estimated at $233,284, approximately $211 per square foot. 243 Fugate St SW is a home located in Washington County with nearby schools including Abingdon Elementary School, E.B. Stanley Middle School, and Abingdon High School.
Ownership History
Date
Name
Owned For
Owner Type
Purchase Details
Closed on
Oct 10, 2024
Sold by
Hoke Timothy R and Hoke Lydia J
Bought by
Tim & Lydia Hoke Trust and Hoke
Current Estimated Value
Purchase Details
Closed on
Nov 22, 2017
Sold by
Cummings Vanessa L
Bought by
Hoke Timothy R and Hoke Lydia J
Purchase Details
Closed on
Jun 22, 2012
Sold by
Fannie Mae
Bought by
Hoke Timothy R
Purchase Details
Closed on
Nov 15, 2011
Sold by
Alg Trustee Llc Sub Tr
Bought by
Onewest Bank Fsb
Create a Home Valuation Report for This Property
The Home Valuation Report is an in-depth analysis detailing your home's value as well as a comparison with similar homes in the area
Home Values in the Area
Average Home Value in this Area
Purchase History
| Date | Buyer | Sale Price | Title Company |
|---|---|---|---|
| Tim & Lydia Hoke Trust | -- | None Listed On Document | |
| Hoke Timothy R | $400 | None Available | |
| Hoke Timothy R | $32,000 | -- | |
| Onewest Bank Fsb | $62,048 | -- |
Source: Public Records
Tax History Compared to Growth
Tax History
| Year | Tax Paid | Tax Assessment Tax Assessment Total Assessment is a certain percentage of the fair market value that is determined by local assessors to be the total taxable value of land and additions on the property. | Land | Improvement |
|---|---|---|---|---|
| 2025 | $677 | $220,300 | $25,000 | $195,300 |
| 2024 | $677 | $112,800 | $20,000 | $92,800 |
| 2023 | $677 | $112,800 | $20,000 | $92,800 |
| 2022 | $691 | $115,100 | $20,000 | $95,100 |
| 2021 | $658 | $109,700 | $20,000 | $89,700 |
| 2020 | $572 | $90,800 | $20,000 | $70,800 |
| 2019 | $470 | $74,600 | $20,000 | $54,600 |
| 2018 | $384 | $60,900 | $20,000 | $40,900 |
| 2017 | $384 | $60,900 | $20,000 | $40,900 |
| 2016 | $380 | $60,300 | $20,000 | $40,300 |
| 2015 | $380 | $60,300 | $20,000 | $40,300 |
| 2014 | $380 | $60,300 | $20,000 | $40,300 |
Source: Public Records
Map
Nearby Homes
- 524 Hagy St SW
- 622 W Main St
- 622 W Main West St
- 211 Butt St SW
- 684 Hallock Cir
- 213 Campbell St SW
- 214 Hallock Dr
- 463 Bradley St SW
- 262 Hallock Dr
- 625 Locust St NW
- 408 Jamison St SW
- 0 Front St SW
- 314 Jamison St SW
- 302 Front St SW
- 956 Maiden St
- 945 Maiden St
- 983 Beverly Dr
- LOT 89 Cheyenne Trail
- tbd Lot 89 E Cheyenne Trail
- Lot 8 Homestead Way
- 243 Fugate
- 239 Fugate St SW
- 233 Fugate St SW
- 638 Hurt St SW
- 632 Hurt St SW
- 623 Hurt St SW
- 619 Hurt St SW
- 624 Hurt St SW
- 624 Hagy St SW
- 617 Hurt St SW
- 616 Hurt St SW
- 600 Hagy St SW
- 704 Mosby St SW
- 0 Village Ct
- 235 Stone Mill Rd
- 243 Stone Mill Rd SW
- 235 Stone Mill Rd SW
- 633 Hagy St SW
- 249 Stone Mill Rd SW
- 227 Stone Mill Rd SW