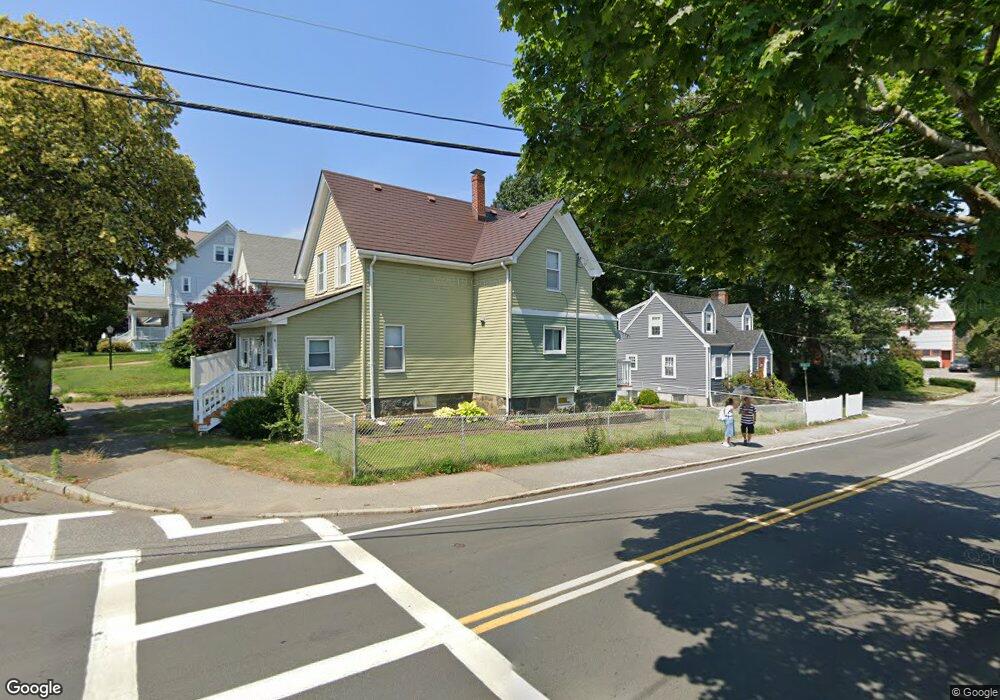
243 Holbrook Rd Quincy, MA 02171
West Quincy NeighborhoodEstimated Value: $670,000 - $726,000
3
Beds
2
Baths
1,190
Sq Ft
$584/Sq Ft
Est. Value
About This Home
This home is located at 243 Holbrook Rd, Quincy, MA 02171 and is currently estimated at $695,124, approximately $584 per square foot. 243 Holbrook Rd is a home located in Norfolk County with nearby schools including Montclair Elementary School, Atlantic Middle School, and North Quincy High School.
Ownership History
Date
Name
Owned For
Owner Type
Purchase Details
Closed on
Jul 5, 2006
Sold by
Ho Khuong L
Bought by
Wingyuen-Tang Betty
Current Estimated Value
Home Financials for this Owner
Home Financials are based on the most recent Mortgage that was taken out on this home.
Original Mortgage
$354,400
Outstanding Balance
$209,817
Interest Rate
6.6%
Mortgage Type
Purchase Money Mortgage
Estimated Equity
$485,307
Create a Home Valuation Report for This Property
The Home Valuation Report is an in-depth analysis detailing your home's value as well as a comparison with similar homes in the area
Home Values in the Area
Average Home Value in this Area
Purchase History
| Date | Buyer | Sale Price | Title Company |
|---|---|---|---|
| Wingyuen-Tang Betty | $318,000 | -- |
Source: Public Records
Mortgage History
| Date | Status | Borrower | Loan Amount |
|---|---|---|---|
| Open | Wingyuen-Tang Betty | $354,400 |
Source: Public Records
Tax History
| Year | Tax Paid | Tax Assessment Tax Assessment Total Assessment is a certain percentage of the fair market value that is determined by local assessors to be the total taxable value of land and additions on the property. | Land | Improvement |
|---|---|---|---|---|
| 2025 | $6,808 | $590,500 | $324,200 | $266,300 |
| 2024 | $6,523 | $578,800 | $324,200 | $254,600 |
| 2023 | $6,119 | $549,800 | $308,800 | $241,000 |
| 2022 | $6,062 | $506,000 | $268,500 | $237,500 |
| 2021 | $5,655 | $465,800 | $255,700 | $210,100 |
| 2020 | $5,587 | $449,500 | $255,700 | $193,800 |
| 2019 | $5,389 | $429,400 | $239,000 | $190,400 |
| 2018 | $5,243 | $393,000 | $221,300 | $171,700 |
| 2017 | $5,108 | $360,500 | $210,800 | $149,700 |
| 2016 | $4,634 | $322,700 | $183,300 | $139,400 |
| 2015 | $4,292 | $294,000 | $166,600 | $127,400 |
| 2014 | $4,087 | $275,000 | $158,700 | $116,300 |
Source: Public Records
Map
Nearby Homes
- 43 Hilma St
- 253 W Squantum St
- 197 Hobart St
- 52 Hamilton Ave
- 98 Safford St
- 154 N Central Ave
- 39 Fayette St Unit 403
- 123 Piermont St
- 52 California Ave
- 17 Holmes St Unit 2
- 17 Holmes St Unit 3
- 406 Beale St
- 440 Granite Ave Unit 201
- 13 Ash St
- 10 Weston Ave Unit 322
- 400 Adams St Unit A
- 70 Walnut St
- 397 Adams St
- 41 Wallace Rd
- 23 Myrtle St
- 247 Holbrook Rd
- 21 Harvard St
- 239 Holbrook Rd
- 253 Holbrook Rd
- 37 Harvard St
- 10 Hilma St
- 235 Holbrook Rd
- 38 Harvard St
- 252 Holbrook Rd
- 256 Holbrook Rd Unit 1
- 256 Holbrook Rd Unit A
- 256 Holbrook Rd
- 252 Holbrook Rd Unit 1
- 14 Harvard St
- 14 Harvard St Unit 2
- 254 Holbrook Rd Unit 1
- 254 Holbrook Rd
- 41 Harvard St
- 231 Holbrook Rd
- 14 Hilma St