243 Lexie Ln Palmyra, VA 22963
Estimated Value: $543,000 - $663,787
4
Beds
4
Baths
2,321
Sq Ft
$266/Sq Ft
Est. Value
About This Home
This home is located at 243 Lexie Ln, Palmyra, VA 22963 and is currently estimated at $617,947, approximately $266 per square foot. 243 Lexie Ln is a home located in Fluvanna County with nearby schools including Central Elementary School, West Central Primary School, and Carysbrook Elementary School.
Ownership History
Date
Name
Owned For
Owner Type
Purchase Details
Closed on
Dec 11, 2009
Sold by
Craig Enterprises Inc
Bought by
Drumheller Eric J and Drumheller Margaret Brittany L
Current Estimated Value
Home Financials for this Owner
Home Financials are based on the most recent Mortgage that was taken out on this home.
Original Mortgage
$304,000
Outstanding Balance
$196,754
Interest Rate
4.75%
Mortgage Type
New Conventional
Estimated Equity
$421,193
Purchase Details
Closed on
Mar 25, 2008
Sold by
Co Sycamore Square Llc
Bought by
Co Craig Enterprises Inc
Create a Home Valuation Report for This Property
The Home Valuation Report is an in-depth analysis detailing your home's value as well as a comparison with similar homes in the area
Home Values in the Area
Average Home Value in this Area
Purchase History
| Date | Buyer | Sale Price | Title Company |
|---|---|---|---|
| Drumheller Eric J | $399,900 | Stewart Title Guaranty Co | |
| Co Craig Enterprises Inc | $90,000 | Chicago Title Insurance |
Source: Public Records
Mortgage History
| Date | Status | Borrower | Loan Amount |
|---|---|---|---|
| Open | Drumheller Eric J | $304,000 |
Source: Public Records
Tax History Compared to Growth
Tax History
| Year | Tax Paid | Tax Assessment Tax Assessment Total Assessment is a certain percentage of the fair market value that is determined by local assessors to be the total taxable value of land and additions on the property. | Land | Improvement |
|---|---|---|---|---|
| 2025 | $5,192 | $692,200 | $35,000 | $657,200 |
| 2024 | $4,336 | $513,800 | $35,000 | $478,800 |
| 2023 | $4,336 | $513,800 | $35,000 | $478,800 |
| 2022 | $3,790 | $435,600 | $35,000 | $400,600 |
| 2021 | $3,790 | $435,600 | $35,000 | $400,600 |
| 2020 | $3,702 | $400,200 | $35,000 | $365,200 |
| 2019 | $3,702 | $400,200 | $35,000 | $365,200 |
| 2018 | $3,247 | $358,000 | $35,000 | $323,000 |
| 2017 | $3,247 | $358,000 | $35,000 | $323,000 |
| 2016 | $2,957 | $322,500 | $35,000 | $287,500 |
| 2015 | $2,722 | $322,500 | $35,000 | $287,500 |
| 2014 | $2,722 | $309,300 | $35,000 | $274,300 |
Source: Public Records
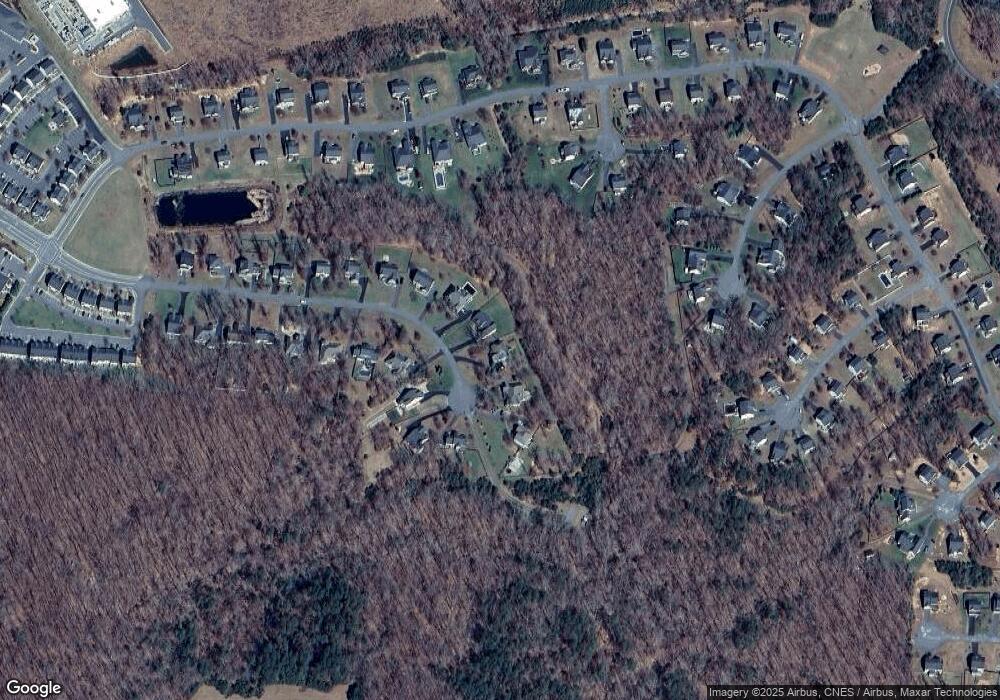
Map
Nearby Homes