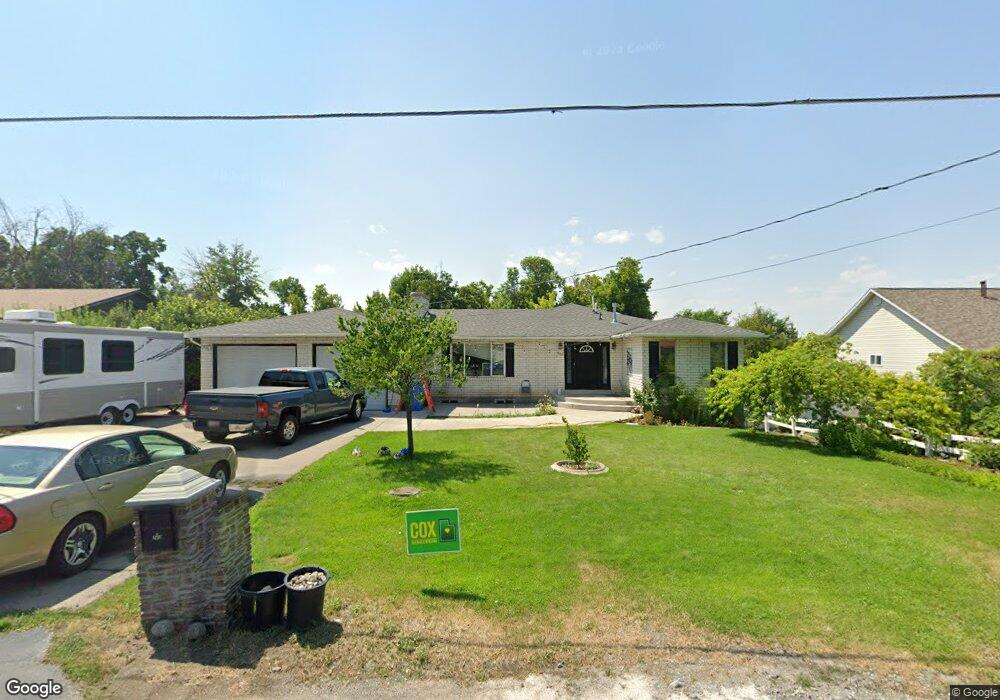
243 N 100 E Providence, UT 84332
Estimated Value: $567,449 - $578,000
5
Beds
3
Baths
4,132
Sq Ft
$139/Sq Ft
Est. Value
About This Home
This home is located at 243 N 100 E, Providence, UT 84332 and is currently estimated at $573,112, approximately $138 per square foot. 243 N 100 E is a home located in Cache County with nearby schools including Providence School, Spring Creek Middle School, and South Cache Middle School.
Ownership History
Date
Name
Owned For
Owner Type
Purchase Details
Closed on
Mar 3, 2016
Sold by
Wendel Spencer C
Bought by
Wendel Spencer C and Wendel Maren C
Current Estimated Value
Home Financials for this Owner
Home Financials are based on the most recent Mortgage that was taken out on this home.
Original Mortgage
$223,200
Outstanding Balance
$176,639
Interest Rate
3.81%
Mortgage Type
New Conventional
Estimated Equity
$396,473
Purchase Details
Closed on
Aug 20, 2009
Sold by
Astle John F and Astle Diane J
Bought by
Astle John F and Astle Diane
Create a Home Valuation Report for This Property
The Home Valuation Report is an in-depth analysis detailing your home's value as well as a comparison with similar homes in the area
Home Values in the Area
Average Home Value in this Area
Purchase History
| Date | Buyer | Sale Price | Title Company |
|---|---|---|---|
| Wendel Spencer C | -- | American Secure Title Logan | |
| Wendel Spencer C | -- | American Secure Title Logan | |
| Astle John F | -- | None Available |
Source: Public Records
Mortgage History
| Date | Status | Borrower | Loan Amount |
|---|---|---|---|
| Open | Wendel Spencer C | $223,200 |
Source: Public Records
Tax History
| Year | Tax Paid | Tax Assessment Tax Assessment Total Assessment is a certain percentage of the fair market value that is determined by local assessors to be the total taxable value of land and additions on the property. | Land | Improvement |
|---|---|---|---|---|
| 2025 | $2,255 | $316,190 | $0 | $0 |
| 2024 | $2,413 | $314,785 | $0 | $0 |
| 2023 | $2,527 | $310,545 | $0 | $0 |
| 2022 | $2,290 | $265,780 | $0 | $0 |
| 2021 | $2,163 | $384,660 | $56,100 | $328,560 |
| 2020 | $2,000 | $329,900 | $56,100 | $273,800 |
| 2019 | $2,332 | $364,032 | $56,100 | $307,932 |
| 2018 | $1,989 | $317,060 | $56,100 | $260,960 |
| 2017 | $1,819 | $153,450 | $0 | $0 |
| 2016 | $1,838 | $153,450 | $0 | $0 |
| 2015 | $1,420 | $118,250 | $0 | $0 |
| 2014 | $1,324 | $113,055 | $0 | $0 |
| 2013 | -- | $113,055 | $0 | $0 |
Source: Public Records
Map
Nearby Homes
- 55 Mountain View Cir
- 201 E 580 N
- 76 E Springs Ln
- 329 N Springs Ln
- 275 N Mountain Ln W
- 151 E 360 N
- 289 Mountain View Ln
- 374 N 100 W
- 175 N 100 W
- 385 N 300 E
- 198 W 150 N
- 188 E 520 N
- 205 E 520 N
- 239 Hidden Creek Dr
- 561 N 225 E
- 192 E 610 N
- 192 E 610 N Unit 415
- 694 S 600 E
- 676 N 275 E Unit 614
- 529 N 470 E
Your Personal Tour Guide
Ask me questions while you tour the home.