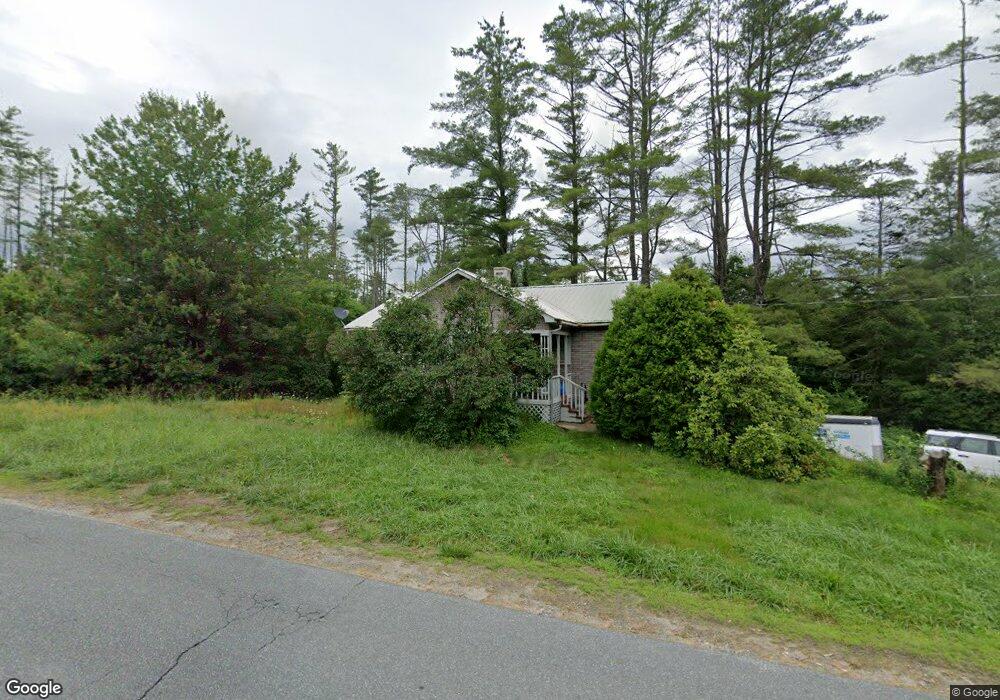
243 Oak St Newport, NH 03773
Estimated Value: $248,000 - $402,000
3
Beds
1
Bath
1,502
Sq Ft
$199/Sq Ft
Est. Value
About This Home
This home is located at 243 Oak St, Newport, NH 03773 and is currently estimated at $298,936, approximately $199 per square foot. 243 Oak St is a home located in Sullivan County with nearby schools including Richards Elementary School, Newport High School, and Newport Montessori School.
Ownership History
Date
Name
Owned For
Owner Type
Purchase Details
Closed on
Oct 29, 2010
Sold by
French Jean M
Bought by
Brogan Carl A and Brogan Susan
Current Estimated Value
Home Financials for this Owner
Home Financials are based on the most recent Mortgage that was taken out on this home.
Original Mortgage
$59,000
Outstanding Balance
$39,165
Interest Rate
4.39%
Mortgage Type
Purchase Money Mortgage
Estimated Equity
$259,771
Purchase Details
Closed on
Jul 29, 1996
Sold by
Berkowitz Constance B
Bought by
French Allen H and French Jean M
Home Financials for this Owner
Home Financials are based on the most recent Mortgage that was taken out on this home.
Original Mortgage
$63,467
Interest Rate
8.37%
Create a Home Valuation Report for This Property
The Home Valuation Report is an in-depth analysis detailing your home's value as well as a comparison with similar homes in the area
Home Values in the Area
Average Home Value in this Area
Purchase History
| Date | Buyer | Sale Price | Title Company |
|---|---|---|---|
| Brogan Carl A | $81,000 | -- | |
| French Allen H | $63,500 | -- |
Source: Public Records
Mortgage History
| Date | Status | Borrower | Loan Amount |
|---|---|---|---|
| Open | French Allen H | $59,000 | |
| Previous Owner | French Allen H | $63,467 |
Source: Public Records
Tax History Compared to Growth
Tax History
| Year | Tax Paid | Tax Assessment Tax Assessment Total Assessment is a certain percentage of the fair market value that is determined by local assessors to be the total taxable value of land and additions on the property. | Land | Improvement |
|---|---|---|---|---|
| 2024 | $4,502 | $185,200 | $63,900 | $121,300 |
| 2023 | $4,367 | $185,200 | $63,900 | $121,300 |
| 2022 | $3,871 | $185,200 | $63,900 | $121,300 |
| 2021 | $3,571 | $108,200 | $38,700 | $69,500 |
| 2020 | $3,581 | $108,200 | $38,700 | $69,500 |
| 2019 | $3,520 | $108,200 | $38,700 | $69,500 |
| 2018 | $3,289 | $108,200 | $38,700 | $69,500 |
| 2017 | $3,250 | $108,200 | $38,700 | $69,500 |
| 2016 | $3,244 | $112,900 | $36,900 | $76,000 |
| 2015 | $3,302 | $112,900 | $36,900 | $76,000 |
| 2014 | $3,572 | $112,900 | $36,900 | $76,000 |
| 2013 | $3,386 | $112,900 | $36,900 | $76,000 |
Source: Public Records
Map
Nearby Homes