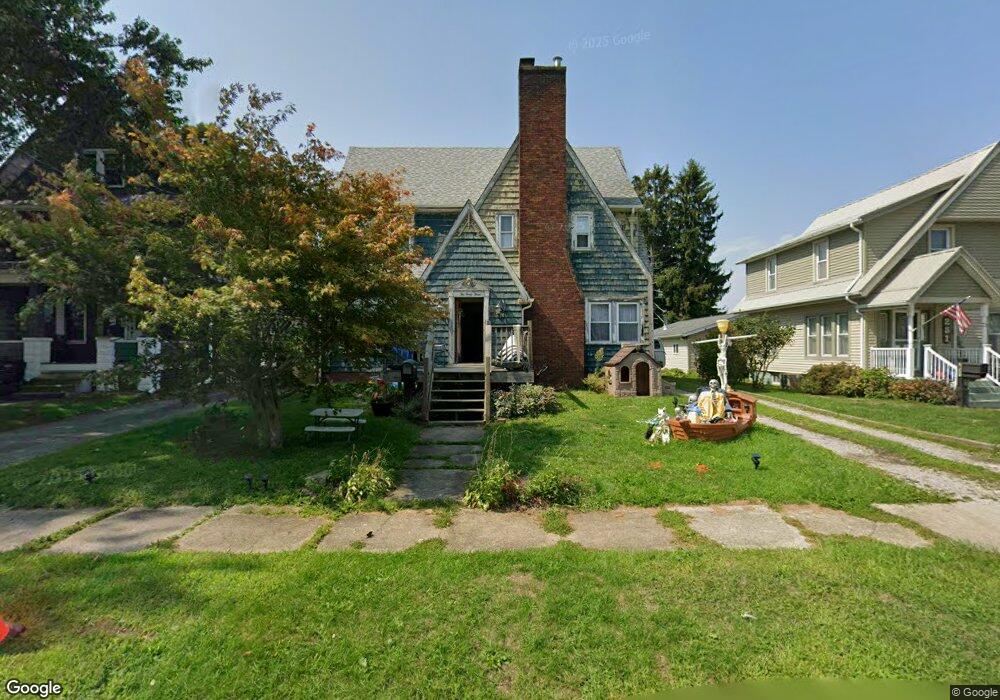
243 Reig Ave Conneaut, OH 44030
Estimated Value: $107,480 - $185,000
3
Beds
2
Baths
2,132
Sq Ft
$66/Sq Ft
Est. Value
About This Home
This home is located at 243 Reig Ave, Conneaut, OH 44030 and is currently estimated at $140,370, approximately $65 per square foot. 243 Reig Ave is a home located in Ashtabula County with nearby schools including Lakeshore Primary Elementary School, Gateway Elementary School, and Conneaut Middle School.
Ownership History
Date
Name
Owned For
Owner Type
Purchase Details
Closed on
Jun 5, 2009
Sold by
Us Bank National Association
Bought by
Edwards David L and Edwards Heidi A
Current Estimated Value
Purchase Details
Closed on
Mar 4, 2009
Sold by
Hutchens Cindy and Hutchens Cindy M
Bought by
Us Bank National Association
Purchase Details
Closed on
Jan 31, 2006
Sold by
Hutchins Kirk A and Hutchins Cindy
Bought by
Hutchins Kirk A and Hutchins Cindy
Purchase Details
Closed on
Nov 26, 2003
Sold by
King Verna E
Bought by
Hutchens Kirk A
Home Financials for this Owner
Home Financials are based on the most recent Mortgage that was taken out on this home.
Original Mortgage
$73,600
Interest Rate
7.35%
Mortgage Type
Unknown
Create a Home Valuation Report for This Property
The Home Valuation Report is an in-depth analysis detailing your home's value as well as a comparison with similar homes in the area
Home Values in the Area
Average Home Value in this Area
Purchase History
| Date | Buyer | Sale Price | Title Company |
|---|---|---|---|
| Edwards David L | $18,000 | Accutitle Agency Inc | |
| Us Bank National Association | $52,000 | None Available | |
| Hutchins Kirk A | -- | None Available | |
| Hutchens Kirk A | $92,000 | Midland Title |
Source: Public Records
Mortgage History
| Date | Status | Borrower | Loan Amount |
|---|---|---|---|
| Previous Owner | Hutchens Kirk A | $73,600 | |
| Closed | Hutchens Kirk A | $18,400 |
Source: Public Records
Tax History Compared to Growth
Tax History
| Year | Tax Paid | Tax Assessment Tax Assessment Total Assessment is a certain percentage of the fair market value that is determined by local assessors to be the total taxable value of land and additions on the property. | Land | Improvement |
|---|---|---|---|---|
| 2024 | $661 | $9,040 | $5,010 | $4,030 |
| 2023 | $435 | $9,040 | $5,010 | $4,030 |
| 2022 | $374 | $6,830 | $3,850 | $2,980 |
| 2021 | $381 | $6,830 | $3,850 | $2,980 |
| 2020 | $380 | $6,830 | $3,850 | $2,980 |
| 2019 | $323 | $5,670 | $2,030 | $3,640 |
| 2018 | $309 | $5,670 | $2,030 | $3,640 |
| 2017 | $169 | $5,670 | $2,030 | $3,640 |
| 2016 | $294 | $5,960 | $2,140 | $3,820 |
| 2015 | $588 | $5,960 | $2,140 | $3,820 |
| 2014 | $759 | $5,960 | $2,140 | $3,820 |
| 2013 | $494 | $11,030 | $3,190 | $7,840 |
Source: Public Records
Map
Nearby Homes
- 855 Spring St Unit S9
- 247 Whitney St
- 589 Main St
- 210 W Main Rd
- 202 W Main Rd Unit 49
- 202 W Main Rd Unit Lot 150
- 202 W Main Rd Unit 33
- 202 W Main Rd Unit 16
- 18 Hillcrest Ct
- 536 Madison St
- 474 Sherman St
- 455 Main St
- 251 St Rt 7
- 220 Daniels Ave
- 429 Depot St
- VL Center Rd
- 1145 Lake Rd
- 1150 Lake Rd
- 459 Mill St
- 2663 Lake Rd