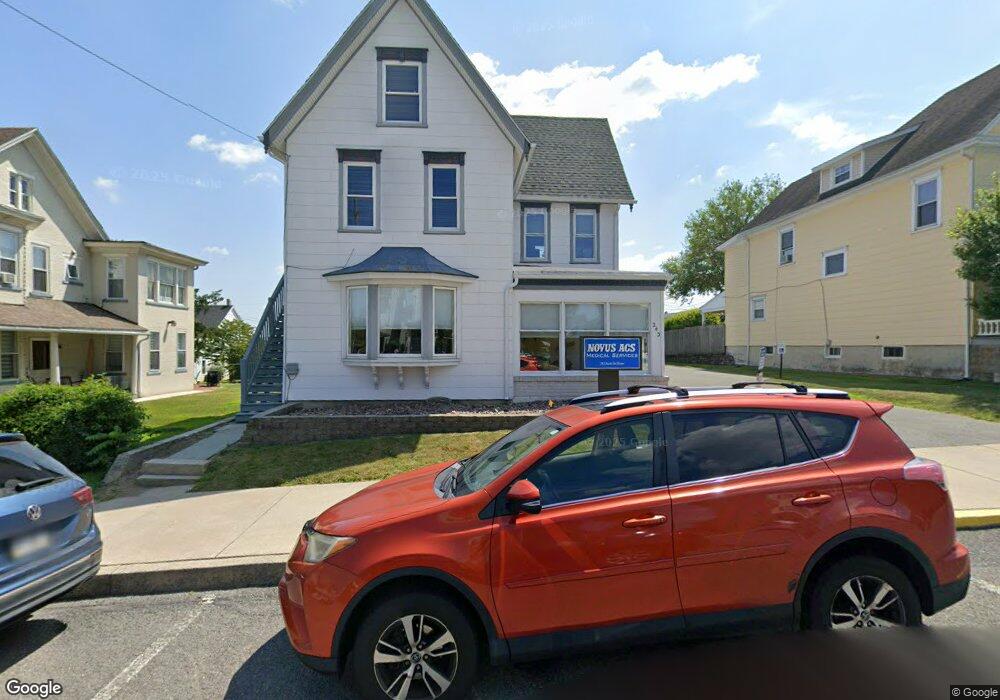
243 S 3rd St Lehighton, PA 18235
Estimated Value: $226,103 - $398,000
4
Beds
2
Baths
2,344
Sq Ft
$127/Sq Ft
Est. Value
About This Home
This home is located at 243 S 3rd St, Lehighton, PA 18235 and is currently estimated at $298,526, approximately $127 per square foot. 243 S 3rd St is a home located in Carbon County with nearby schools including Lehighton Area High School, Sts. Peter & Paul School, and Valley Ridge Academy.
Ownership History
Date
Name
Owned For
Owner Type
Purchase Details
Closed on
Dec 12, 2019
Sold by
Rheiner John L and Breiner Bruce F
Bought by
Novus Re Llc
Current Estimated Value
Home Financials for this Owner
Home Financials are based on the most recent Mortgage that was taken out on this home.
Original Mortgage
$136,000
Outstanding Balance
$106,324
Interest Rate
3.6%
Mortgage Type
Future Advance Clause Open End Mortgage
Estimated Equity
$192,202
Purchase Details
Closed on
Sep 10, 2008
Sold by
Eidem Kathleen A
Bought by
Rheiner John L and Breiner Bruce F
Home Financials for this Owner
Home Financials are based on the most recent Mortgage that was taken out on this home.
Original Mortgage
$207,000
Interest Rate
6.58%
Mortgage Type
Purchase Money Mortgage
Create a Home Valuation Report for This Property
The Home Valuation Report is an in-depth analysis detailing your home's value as well as a comparison with similar homes in the area
Home Values in the Area
Average Home Value in this Area
Purchase History
| Date | Buyer | Sale Price | Title Company |
|---|---|---|---|
| Novus Re Llc | $205,000 | Santanasto Abstract & Setmnt | |
| Rheiner John L | $212,000 | None Available |
Source: Public Records
Mortgage History
| Date | Status | Borrower | Loan Amount |
|---|---|---|---|
| Open | Novus Re Llc | $136,000 | |
| Previous Owner | Rheiner John L | $207,000 |
Source: Public Records
Tax History Compared to Growth
Tax History
| Year | Tax Paid | Tax Assessment Tax Assessment Total Assessment is a certain percentage of the fair market value that is determined by local assessors to be the total taxable value of land and additions on the property. | Land | Improvement |
|---|---|---|---|---|
| 2025 | $3,486 | $43,700 | $5,300 | $38,400 |
| 2024 | $3,311 | $43,700 | $5,300 | $38,400 |
| 2023 | $3,278 | $43,700 | $5,300 | $38,400 |
| 2022 | $3,278 | $43,700 | $5,300 | $38,400 |
| 2021 | $3,163 | $43,700 | $5,300 | $38,400 |
| 2020 | $3,087 | $43,700 | $5,300 | $38,400 |
| 2019 | $2,955 | $43,700 | $5,300 | $38,400 |
| 2018 | $2,890 | $43,700 | $5,300 | $38,400 |
| 2017 | $2,868 | $43,700 | $5,300 | $38,400 |
| 2016 | -- | $43,700 | $5,300 | $38,400 |
| 2015 | -- | $43,700 | $5,300 | $38,400 |
| 2014 | -- | $43,700 | $5,300 | $38,400 |
Source: Public Records
Map
Nearby Homes
- 236 S 2nd St
- 230 S 2nd St
- 196 S 3rd St
- 193 S 4th St
- 193 S 4th St Unit 191-193
- 142 Bankway St
- 12 2nd Ave
- 522 Iron St
- 117 N 4th St
- 639 Iron St
- 215 N 4th St
- 231 Coal St
- 410 S 8th St
- 344 Ochre St
- 0 Fairyland Rd Unit PM-136987
- 438 White St
- 230 Carbon St
- 470 N 8th St
- 0 Emily Plan at Summit Point Unit PACC2005480
- 0 Copper Beech Plan at Summit Ridge Unit PACC2005478