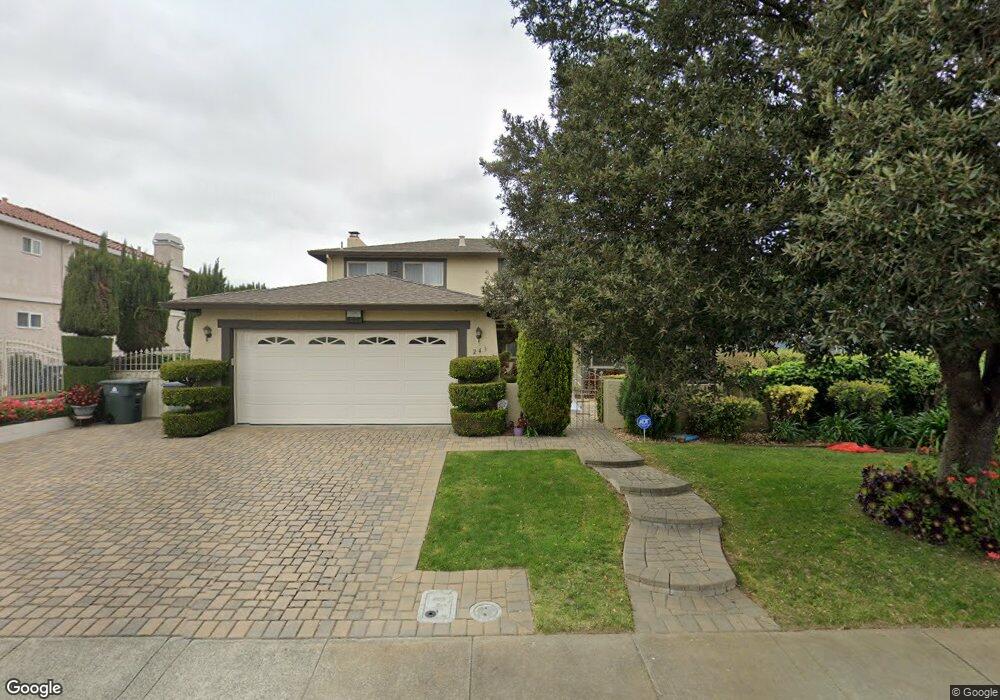
243 Torrey Pines Ct Vallejo, CA 94591
Estimated Value: $713,000 - $817,000
4
Beds
3
Baths
3,124
Sq Ft
$244/Sq Ft
Est. Value
About This Home
This home is located at 243 Torrey Pines Ct, Vallejo, CA 94591 and is currently estimated at $762,657, approximately $244 per square foot. 243 Torrey Pines Ct is a home located in Solano County with nearby schools including Joseph H. Wardlaw Elementary School, Hogan Middle School, and Jesse M. Bethel High School.
Ownership History
Date
Name
Owned For
Owner Type
Purchase Details
Closed on
Jan 26, 2012
Sold by
Johnson Bunyan W
Bought by
Johnson Bunyan W
Current Estimated Value
Home Financials for this Owner
Home Financials are based on the most recent Mortgage that was taken out on this home.
Original Mortgage
$173,999
Outstanding Balance
$20,187
Interest Rate
3.17%
Mortgage Type
New Conventional
Estimated Equity
$742,470
Purchase Details
Closed on
Jun 17, 1993
Sold by
Johnson Bunyan W and Johnson Doris L
Bought by
Johnson Bunyan Washington and Johnson Doris L
Purchase Details
Closed on
Jun 11, 1993
Sold by
Johnson Bunyan W and Johnson Doris L
Bought by
Johnson Bunyan Washington and Johnson Doris Lee
Create a Home Valuation Report for This Property
The Home Valuation Report is an in-depth analysis detailing your home's value as well as a comparison with similar homes in the area
Home Values in the Area
Average Home Value in this Area
Purchase History
| Date | Buyer | Sale Price | Title Company |
|---|---|---|---|
| Johnson Bunyan W | -- | Lsi | |
| Johnson Bunyan Washington | -- | -- | |
| Johnson Bunyan W | -- | -- | |
| Johnson Bunyan Washington | -- | -- |
Source: Public Records
Mortgage History
| Date | Status | Borrower | Loan Amount |
|---|---|---|---|
| Open | Johnson Bunyan W | $173,999 |
Source: Public Records
Tax History Compared to Growth
Tax History
| Year | Tax Paid | Tax Assessment Tax Assessment Total Assessment is a certain percentage of the fair market value that is determined by local assessors to be the total taxable value of land and additions on the property. | Land | Improvement |
|---|---|---|---|---|
| 2025 | $3,565 | $367,919 | $62,151 | $305,768 |
| 2024 | $3,565 | $360,706 | $60,933 | $299,773 |
| 2023 | $3,411 | $353,635 | $59,739 | $293,896 |
| 2022 | $3,405 | $346,702 | $58,568 | $288,134 |
| 2021 | $3,324 | $339,905 | $57,420 | $282,485 |
| 2020 | $3,360 | $336,421 | $56,832 | $279,589 |
| 2019 | $3,264 | $329,825 | $55,718 | $274,107 |
| 2018 | $3,086 | $323,359 | $54,626 | $268,733 |
| 2017 | $2,906 | $317,019 | $53,555 | $263,464 |
| 2016 | $3,761 | $310,804 | $52,505 | $258,299 |
| 2015 | $3,689 | $306,137 | $51,717 | $254,420 |
| 2014 | $3,635 | $300,141 | $50,704 | $249,437 |
Source: Public Records
Map
Nearby Homes
- 6857 Sunriver Ln
- 6206 Pebble Beach Dr
- 880 Knights Cir
- 841 Knights Cir
- 367 Darley Dr
- 6320 Pebble Beach Dr
- 131 Sheila Ct
- 134 Nashville Ln
- 1407 Eucalyptus Dr
- 2011 Agate Ct
- 730 Britannia Dr
- 2139 Garnet Cir
- 3554 Calm Breeze Ct
- 136 Evergreen Way
- 351 Springbrook Dr
- 103 Sandalwood Ct
- 272 Woodridge Dr
- 2500 Springs Rd Unit 121
- 2500 Springs Rd Unit 116
- 7809 Caracena Ct
- 237 Torrey Pines Ct
- 249 Torrey Pines Ct
- 231 Torrey Pines Ct
- 255 Torrey Pines Ct
- 242 Torrey Pines Ct
- 236 Torrey Pines Ct
- 260 Torrey Pines Ct
- 213 Torrey Pines Ct
- 248 Torrey Pines Ct
- 254 Torrey Pines Ct
- 219 Torrey Pines Ct
- 224 Torrey Pines Ct
- 207 Torrey Pines Ct
- 206 Torrey Pines Ct
- 225 Torrey Pines Ct
- 100 Doral Ct
- 106 Doral Ct
- 200 Torrey Pines Ct
- 112 Doral Ct
- 148 Turnberry Way