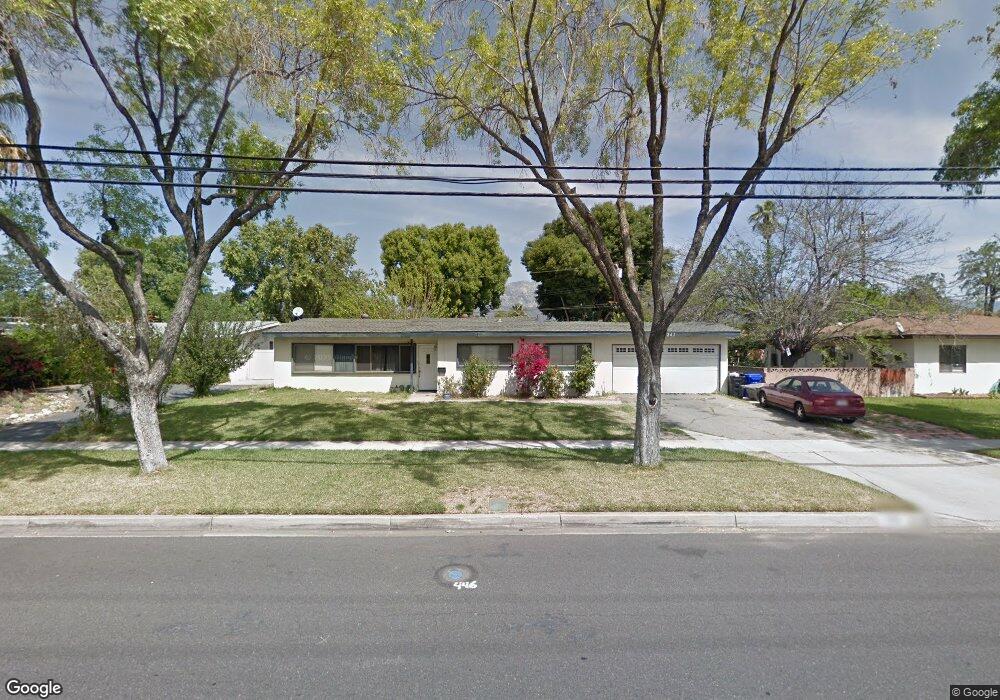
243 W 8th St Upland, CA 91786
Estimated Value: $793,000 - $865,000
4
Beds
2
Baths
2,500
Sq Ft
$335/Sq Ft
Est. Value
About This Home
This home is located at 243 W 8th St, Upland, CA 91786 and is currently estimated at $836,296, approximately $334 per square foot. 243 W 8th St is a home located in San Bernardino County with nearby schools including Citrus Elementary, Upland Junior High School, and Upland High School.
Ownership History
Date
Name
Owned For
Owner Type
Purchase Details
Closed on
May 30, 2019
Sold by
Mildren David Lee
Bought by
Mildren David Lee and Mildren Eva Marie
Current Estimated Value
Purchase Details
Closed on
Apr 4, 2012
Sold by
Speer Valerie Anne
Bought by
Mildren David Lee
Purchase Details
Closed on
Sep 12, 2003
Sold by
Mildren Donald Arthur Buddy
Bought by
Mildren David L and Mildren Valerie A
Home Financials for this Owner
Home Financials are based on the most recent Mortgage that was taken out on this home.
Original Mortgage
$151,000
Interest Rate
6.4%
Mortgage Type
Purchase Money Mortgage
Purchase Details
Closed on
Apr 26, 2001
Sold by
Mildren Donald Arthur Buddy
Bought by
Mildren Donald Arthur Buddy and Mildren David Lee
Create a Home Valuation Report for This Property
The Home Valuation Report is an in-depth analysis detailing your home's value as well as a comparison with similar homes in the area
Home Values in the Area
Average Home Value in this Area
Purchase History
| Date | Buyer | Sale Price | Title Company |
|---|---|---|---|
| Mildren David Lee | -- | None Available | |
| Mildren David Lee | -- | None Available | |
| Mildren David L | -- | Fidelity National Title | |
| Mildren Donald Arthur Buddy | -- | -- |
Source: Public Records
Mortgage History
| Date | Status | Borrower | Loan Amount |
|---|---|---|---|
| Previous Owner | Mildren David L | $151,000 |
Source: Public Records
Tax History
| Year | Tax Paid | Tax Assessment Tax Assessment Total Assessment is a certain percentage of the fair market value that is determined by local assessors to be the total taxable value of land and additions on the property. | Land | Improvement |
|---|---|---|---|---|
| 2025 | $5,274 | $472,239 | $162,086 | $310,153 |
| 2024 | $5,107 | $462,980 | $158,908 | $304,072 |
| 2023 | $5,030 | $453,902 | $155,792 | $298,110 |
| 2022 | $4,994 | $445,002 | $152,737 | $292,265 |
| 2021 | $4,916 | $436,276 | $149,742 | $286,534 |
| 2020 | $4,782 | $431,803 | $148,207 | $283,596 |
| 2019 | $4,691 | $423,336 | $145,301 | $278,035 |
| 2018 | $4,575 | $415,035 | $142,452 | $272,583 |
| 2017 | $4,442 | $406,897 | $139,659 | $267,238 |
| 2016 | $4,229 | $398,919 | $136,921 | $261,998 |
| 2015 | $4,132 | $392,927 | $134,864 | $258,063 |
| 2014 | $4,025 | $385,230 | $132,222 | $253,008 |
Source: Public Records
Map
Nearby Homes
- 345 Euclid Place
- 428 W 8th St
- 296 S Laurel Ave
- 333 White Ave
- 107 N 1st Ave
- 181 E 8th St
- 145 N 1st Ave
- 157 N 1st Ave
- 161 N 1st Ave
- 306 S Vallejo Way
- 435 W 9th St Unit B3
- 1550 N Bonita Ct
- 340 W Caroline Ct
- 196 Eureka Place
- 123 Macintosh Way
- 580 Katy Dr
- 595 Orlando Ct
- 548 N 2nd Ave
- 617 N Ukiah Way
- 693 N Euclid Ave
Your Personal Tour Guide
Ask me questions while you tour the home.