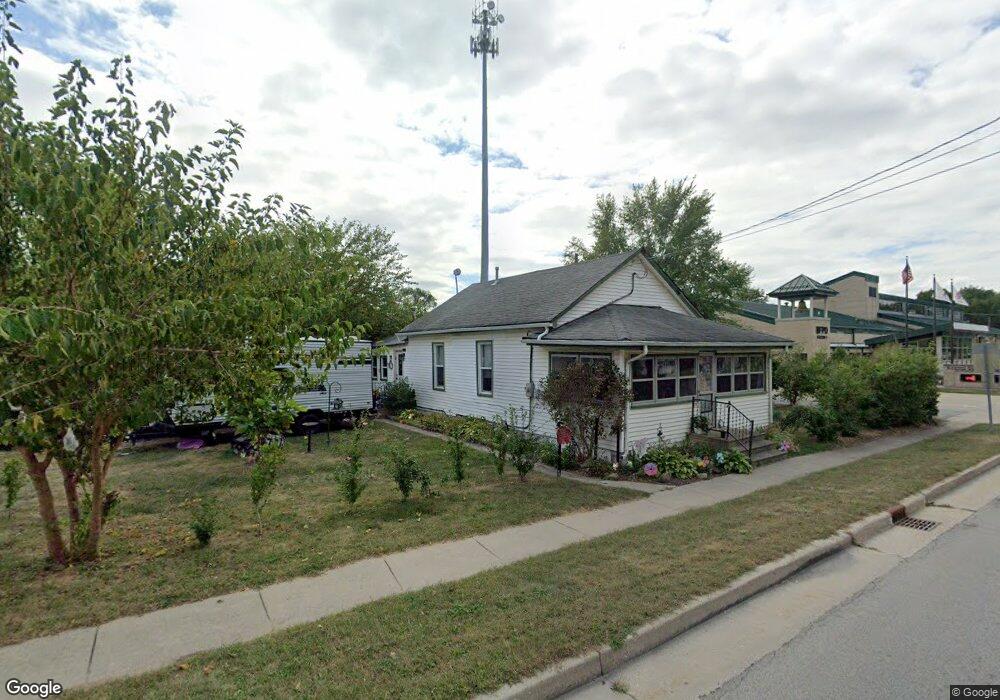
243 W Main St Braidwood, IL 60408
Estimated Value: $139,000 - $233,000
2
Beds
2
Baths
900
Sq Ft
$197/Sq Ft
Est. Value
About This Home
This home is located at 243 W Main St, Braidwood, IL 60408 and is currently estimated at $177,380, approximately $197 per square foot. 243 W Main St is a home located in Will County with nearby schools including Reed-Custer Intermediate School, Reed-Custer Middle School, and Reed-Custer High School.
Ownership History
Date
Name
Owned For
Owner Type
Purchase Details
Closed on
Jun 6, 2018
Sold by
Wells Fargo Bank Na
Bought by
Bhatia Ramesh
Current Estimated Value
Purchase Details
Closed on
Aug 9, 2017
Sold by
Lerfald Melissa A and Porter Carlos
Bought by
Wells Fargo Bank Na
Purchase Details
Closed on
Jul 6, 2017
Sold by
Porter Carlos
Bought by
Wells Fargo Bank Na
Purchase Details
Closed on
Jun 14, 2001
Sold by
Hiller Rodger L and Hiller Barbara J
Bought by
Lerfald Melissa A and Porter Carlos
Home Financials for this Owner
Home Financials are based on the most recent Mortgage that was taken out on this home.
Original Mortgage
$71,811
Interest Rate
7.16%
Mortgage Type
FHA
Purchase Details
Closed on
Jul 30, 1997
Sold by
Firstar Bank Illinois
Bought by
Hiller Roger L and Hiller Barbara J
Home Financials for this Owner
Home Financials are based on the most recent Mortgage that was taken out on this home.
Original Mortgage
$49,500
Interest Rate
7.71%
Create a Home Valuation Report for This Property
The Home Valuation Report is an in-depth analysis detailing your home's value as well as a comparison with similar homes in the area
Home Values in the Area
Average Home Value in this Area
Purchase History
| Date | Buyer | Sale Price | Title Company |
|---|---|---|---|
| Bhatia Ramesh | $37,000 | Attorney | |
| Wells Fargo Bank Na | $40,150 | Attorney | |
| Wells Fargo Bank Na | $40,150 | Attorney | |
| Lerfald Melissa A | $72,500 | Ticor Title | |
| Hiller Roger L | $55,000 | Chicago Title Insurance Co |
Source: Public Records
Mortgage History
| Date | Status | Borrower | Loan Amount |
|---|---|---|---|
| Previous Owner | Lerfald Melissa A | $71,811 | |
| Previous Owner | Hiller Roger L | $49,500 |
Source: Public Records
Tax History Compared to Growth
Tax History
| Year | Tax Paid | Tax Assessment Tax Assessment Total Assessment is a certain percentage of the fair market value that is determined by local assessors to be the total taxable value of land and additions on the property. | Land | Improvement |
|---|---|---|---|---|
| 2024 | $2,075 | $30,818 | $12,168 | $18,650 |
| 2023 | $2,075 | $27,602 | $10,898 | $16,704 |
| 2022 | $1,953 | $25,047 | $9,889 | $15,158 |
| 2021 | $1,691 | $23,907 | $9,439 | $14,468 |
| 2020 | $1,625 | $22,650 | $8,943 | $13,707 |
| 2019 | $919 | $12,888 | $8,445 | $4,443 |
| 2018 | $887 | $44,498 | $8,081 | $36,417 |
| 2017 | $3,121 | $43,626 | $7,923 | $35,703 |
| 2016 | $3,049 | $42,191 | $7,662 | $34,529 |
| 2015 | $2,941 | $41,102 | $7,464 | $33,638 |
| 2014 | $2,941 | $41,102 | $7,464 | $33,638 |
| 2013 | $2,941 | $43,959 | $7,983 | $35,976 |
Source: Public Records
Map
Nearby Homes
- 124 S Lincoln St
- 443 W Main St
- 145 E Elm St
- 000 N Center St
- 106 Round House St
- 340 N Walker St
- 303 N Division St
- 460 N School St
- 470 N School St
- 302 Oak St
- 355 E Janet Dr
- 495 N Division St
- 0000 N Division St
- 605 N Division St
- 642 W Bergera Rd
- 495 W 6th St
- 116 S English St
- 225 E Cermak Rd
- 000 W Cermak Rd
- 910 W Kennedy Rd
- 255 W Main St
- 256 W Main St
- 256 W Main St
- 240 W Main St
- 266 W Main St
- 236 W Main St
- 280 W Main St
- 210 W Main St
- 114 S Lincoln St
- 116 N Lincoln St
- 118 S Lincoln St
- 126 N Lincoln St
- 5 N School St
- 121 N School St
- 111 N Lincoln St
- 113 S Lincoln St
- 109 S Lincoln St
- 119 S School St
- 150 S School St
- 115 S Lincoln St