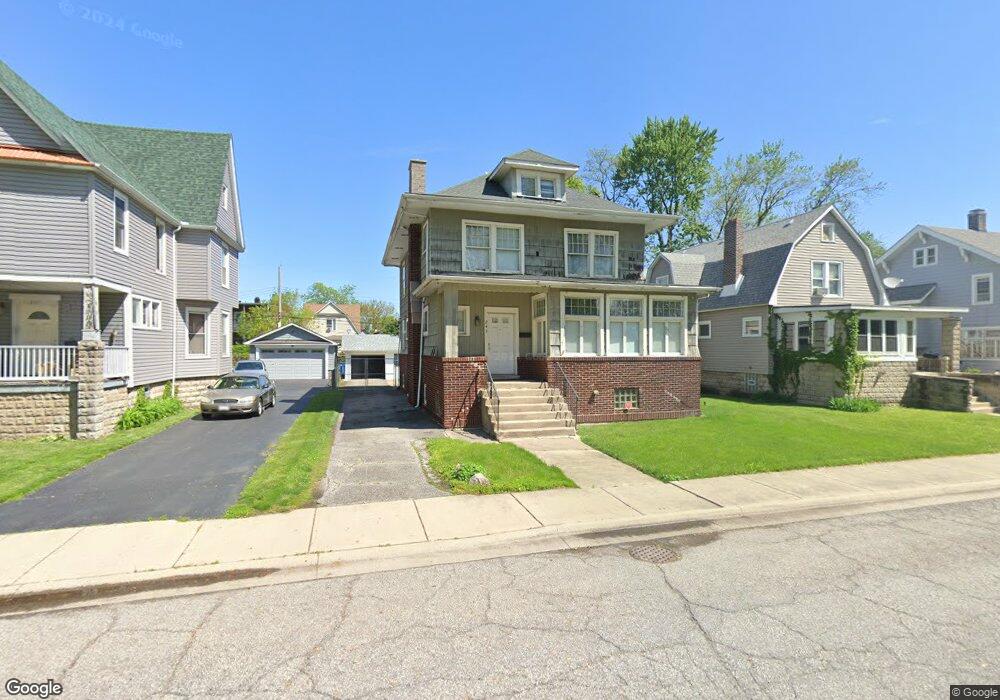
243 Webb St Hammond, IN 46320
Estimated Value: $129,000 - $258,000
4
Beds
2
Baths
2,518
Sq Ft
$79/Sq Ft
Est. Value
About This Home
This home is located at 243 Webb St, Hammond, IN 46320 and is currently estimated at $200,148, approximately $79 per square foot. 243 Webb St is a home located in Lake County with nearby schools including Lew Wallace Elementary School, Eggers Middle School, and Hammond High School.
Ownership History
Date
Name
Owned For
Owner Type
Purchase Details
Closed on
Apr 10, 2018
Sold by
Howard Victor T
Bought by
Howard Dorphine and Howard Vicki T
Current Estimated Value
Purchase Details
Closed on
Mar 9, 2009
Sold by
Fannie Mae
Bought by
Howard Victor T
Home Financials for this Owner
Home Financials are based on the most recent Mortgage that was taken out on this home.
Original Mortgage
$81,839
Outstanding Balance
$51,389
Interest Rate
5.22%
Mortgage Type
FHA
Estimated Equity
$148,759
Purchase Details
Closed on
Oct 3, 2008
Sold by
Flores David
Bought by
Federal National Mortgage Association
Create a Home Valuation Report for This Property
The Home Valuation Report is an in-depth analysis detailing your home's value as well as a comparison with similar homes in the area
Home Values in the Area
Average Home Value in this Area
Purchase History
| Date | Buyer | Sale Price | Title Company |
|---|---|---|---|
| Howard Dorphine | -- | None Available | |
| Howard Victor T | -- | Title One | |
| Federal National Mortgage Association | $167,934 | None Available |
Source: Public Records
Mortgage History
| Date | Status | Borrower | Loan Amount |
|---|---|---|---|
| Open | Howard Victor T | $81,839 |
Source: Public Records
Tax History
| Year | Tax Paid | Tax Assessment Tax Assessment Total Assessment is a certain percentage of the fair market value that is determined by local assessors to be the total taxable value of land and additions on the property. | Land | Improvement |
|---|---|---|---|---|
| 2025 | $1,993 | $173,300 | $21,400 | $151,900 |
| 2024 | $7,103 | $156,000 | $21,400 | $134,600 |
| 2023 | $1,811 | $148,600 | $22,000 | $126,600 |
| 2022 | $1,811 | $140,800 | $22,000 | $118,800 |
| 2021 | $853 | $78,100 | $11,000 | $67,100 |
| 2020 | $720 | $73,900 | $11,000 | $62,900 |
| 2019 | $814 | $70,300 | $12,900 | $57,400 |
| 2018 | $682 | $64,700 | $12,900 | $51,800 |
| 2017 | $788 | $66,600 | $19,800 | $46,800 |
| 2016 | $720 | $68,800 | $19,800 | $49,000 |
| 2014 | $640 | $68,400 | $19,800 | $48,600 |
| 2013 | $475 | $132,200 | $19,800 | $112,400 |
Source: Public Records
Map
Nearby Homes
Your Personal Tour Guide
Ask me questions while you tour the home.