2430 S County Road 275 E North Vernon, IN 47265
Estimated Value: $310,000 - $315,000
3
Beds
--
Bath
806
Sq Ft
$387/Sq Ft
Est. Value
About This Home
This home is located at 2430 S County Road 275 E, North Vernon, IN 47265 and is currently estimated at $312,138, approximately $387 per square foot. 2430 S County Road 275 E is a home located in Jennings County with nearby schools including Brush Creek Elementary School, Jennings County Middle School, and Jennings County High School.
Ownership History
Date
Name
Owned For
Owner Type
Purchase Details
Closed on
Sep 11, 2020
Sold by
King Larry Dean
Bought by
Sanders Charles D and Sanders Jessica R
Current Estimated Value
Home Financials for this Owner
Home Financials are based on the most recent Mortgage that was taken out on this home.
Original Mortgage
$190,805
Outstanding Balance
$162,831
Interest Rate
2.9%
Mortgage Type
Construction
Estimated Equity
$149,307
Purchase Details
Closed on
Sep 8, 2020
Sold by
Ford Melvin Dean
Bought by
King Larry Dean
Home Financials for this Owner
Home Financials are based on the most recent Mortgage that was taken out on this home.
Original Mortgage
$190,805
Outstanding Balance
$162,831
Interest Rate
2.9%
Mortgage Type
Construction
Estimated Equity
$149,307
Purchase Details
Closed on
May 30, 2002
Sold by
Mary King
Bought by
King Nancy Kay and King Larry Dean
Create a Home Valuation Report for This Property
The Home Valuation Report is an in-depth analysis detailing your home's value as well as a comparison with similar homes in the area
Home Values in the Area
Average Home Value in this Area
Purchase History
| Date | Buyer | Sale Price | Title Company |
|---|---|---|---|
| Sanders Charles D | -- | None Available | |
| King Larry Dean | -- | None Available | |
| King Nancy Kay | -- | -- |
Source: Public Records
Mortgage History
| Date | Status | Borrower | Loan Amount |
|---|---|---|---|
| Open | Sanders Charles D | $190,805 |
Source: Public Records
Tax History Compared to Growth
Tax History
| Year | Tax Paid | Tax Assessment Tax Assessment Total Assessment is a certain percentage of the fair market value that is determined by local assessors to be the total taxable value of land and additions on the property. | Land | Improvement |
|---|---|---|---|---|
| 2024 | $2,319 | $247,200 | $26,200 | $221,000 |
| 2023 | $2,019 | $226,800 | $24,000 | $202,800 |
| 2022 | $665 | $40,100 | $21,700 | $18,400 |
| 2021 | $679 | $37,400 | $20,500 | $16,900 |
| 2020 | $480 | $40,000 | $21,100 | $18,900 |
| 2019 | $554 | $40,900 | $22,800 | $18,100 |
| 2018 | $507 | $39,600 | $23,200 | $16,400 |
| 2017 | $513 | $40,300 | $24,700 | $15,600 |
| 2016 | $517 | $41,000 | $25,400 | $15,600 |
| 2014 | $191 | $44,400 | $25,900 | $18,500 |
Source: Public Records
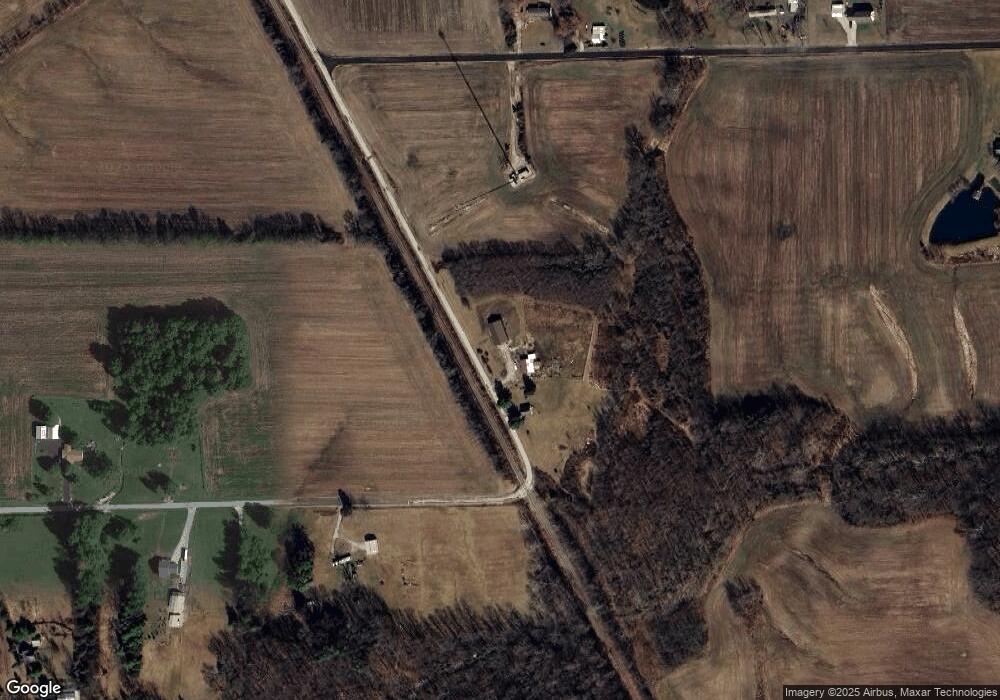
Map
Nearby Homes
- 2030 S County Road 300 E
- 2410 S State Highway 7
- 1855 E County Road 150 S
- 1980 E County Road 100 S
- 935 S County Road 185 E
- 800 S Bay Hill
- 0 S Cr 450 E
- 1000 E County Road 55 S
- 3035 E County Road 500 S
- 2350 E County Road 20 N
- 0 N State Highway 7 Unit MBR21932617
- 0 E Apache Trail
- 130 South St
- 85 E 91 State Highway 3
- 1740 S County Road 600 E
- 23 E Brown St
- 75 Ripley St
- 6310 E County Road 200 S
- 3 N State St
- 1040 E Cherry Blossom Ln
- 2390 E County Road 250 S
- 2390 E County Road 250 S
- 2700 E County Road 225 S
- 2780 E County Road 225 S
- 2335 E County Road 250 S
- 2945 E County Road 225 S
- 2165 S County Road 300 E
- 2435 E County Road 250 S
- 2255 E County Road 250 S
- 3195 E County Road 225 S
- 3155 E County Road 225 S
- 1995 E County Road 250 S
- 2680 S State Highway 7
- 2420 S State Highway 7
- 2620 E County Road 300 S
- 2430 S State Highway 7
- 225 South St
- 2410 E County Road 300 S