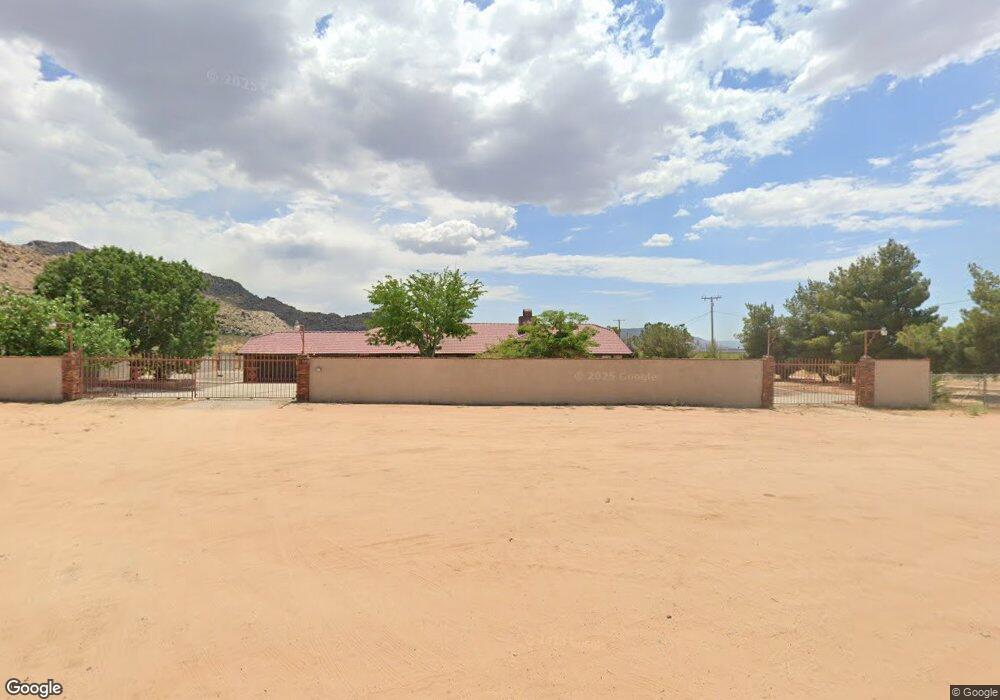
24309 Yucca Loma Rd Apple Valley, CA 92307
Estimated Value: $585,359 - $646,000
3
Beds
3
Baths
2,995
Sq Ft
$203/Sq Ft
Est. Value
About This Home
This home is located at 24309 Yucca Loma Rd, Apple Valley, CA 92307 and is currently estimated at $606,590, approximately $202 per square foot. 24309 Yucca Loma Rd is a home located in San Bernardino County with nearby schools including Sycamore Rocks Elementary School and Granite Hills High School.
Ownership History
Date
Name
Owned For
Owner Type
Purchase Details
Closed on
Dec 13, 2023
Sold by
Carroll Llawanna F
Bought by
Llawanna Faye Carroll Living Trust and Carroll
Current Estimated Value
Purchase Details
Closed on
Jan 2, 2013
Sold by
Carroll Philip L
Bought by
Carroll Llawanna F
Purchase Details
Closed on
May 11, 2000
Sold by
Jensen Lloyd R
Bought by
Carroll Philip L and Carroll Llawanna F
Home Financials for this Owner
Home Financials are based on the most recent Mortgage that was taken out on this home.
Original Mortgage
$232,500
Interest Rate
8.67%
Purchase Details
Closed on
Jul 19, 1999
Sold by
Olsen Sharon M
Bought by
Jensen Lloyd R and Jensen Wilma Lorene
Purchase Details
Closed on
Oct 17, 1996
Sold by
Interlicchia Christopher C and Interlicchia Sharon M
Bought by
Jensen Lloyd R and Jensen Wilma Lorene
Create a Home Valuation Report for This Property
The Home Valuation Report is an in-depth analysis detailing your home's value as well as a comparison with similar homes in the area
Home Values in the Area
Average Home Value in this Area
Purchase History
| Date | Buyer | Sale Price | Title Company |
|---|---|---|---|
| Llawanna Faye Carroll Living Trust | -- | None Listed On Document | |
| Carroll Llawanna F | -- | None Available | |
| Carroll Philip L | $275,000 | First American Title Ins Co | |
| Jensen Lloyd R | -- | -- | |
| Jensen Lloyd R | -- | -- |
Source: Public Records
Mortgage History
| Date | Status | Borrower | Loan Amount |
|---|---|---|---|
| Previous Owner | Carroll Philip L | $232,500 | |
| Closed | Carroll Philip L | $22,500 |
Source: Public Records
Tax History Compared to Growth
Tax History
| Year | Tax Paid | Tax Assessment Tax Assessment Total Assessment is a certain percentage of the fair market value that is determined by local assessors to be the total taxable value of land and additions on the property. | Land | Improvement |
|---|---|---|---|---|
| 2025 | $4,612 | $407,307 | $15,373 | $391,934 |
| 2024 | $4,612 | $399,321 | $15,072 | $384,249 |
| 2023 | $4,573 | $391,491 | $14,776 | $376,715 |
| 2022 | $4,506 | $383,814 | $14,486 | $369,328 |
| 2021 | $4,405 | $376,288 | $14,202 | $362,086 |
| 2020 | $4,353 | $372,429 | $14,056 | $358,373 |
| 2019 | $4,274 | $365,126 | $13,780 | $351,346 |
| 2018 | $4,171 | $357,967 | $13,510 | $344,457 |
| 2017 | $4,116 | $350,948 | $13,245 | $337,703 |
| 2016 | $3,990 | $344,066 | $12,985 | $331,081 |
| 2015 | $3,932 | $338,898 | $12,790 | $326,108 |
| 2014 | $3,882 | $332,259 | $12,539 | $319,720 |
Source: Public Records
Map
Nearby Homes
- 0 Yucca Loma Rd Unit HD25251197
- 0 Yucca Loma Rd Unit HD25145226
- 2 Fairview Valley Rd
- 0 Mustang Unit 219123815DA
- 0 Mustang Unit HD25221385
- 0 Mustang Unit HD25129860
- 13367 Mustang Ave
- 0 Japatul Rd Unit HD24162953
- 0 Japatul Rd Unit IV25111794
- 0 Japatul Rd Unit IG25036655
- 0 Japatul Rd Unit HD24120024
- 13776 Natoma Rd
- 0 Laguna Seca Dr Unit HD25141285
- 14140 Lynn Rd
- 3 Lynn Rd
- 23456 Ottawa Rd Unit 92
- 0 Ottawa Rd
- 0 Nisqually Rd Unit HD25219762
- 0 Nisqually Rd Unit HD25173468
- 7 Joshua Rd
- 24312 Itasca Rd
- 13724 Yuma Rd
- 0 Yucca Loma Rd Unit SR18071329
- 0 Yucca Loma Rd Unit C09059930
- 0 Yucca Loma Rd Unit E11063475
- 0 Yucca Loma Rd Unit E12029445
- 0 Yucca Loma Rd Unit I12050000
- 0 Yucca Loma Rd Unit E12075549
- 0 Yucca Loma Rd Unit WS14127361
- 0 Yucca Loma Rd Unit EV16040770
- 0 Yucca Loma Rd Unit EV16067193
- 0 Yucca Loma Rd Unit CV16079102
- 0 Yucca Loma Rd Unit CV16147607
- 0 Yucca Loma Rd Unit CV17012478
- 0 Yucca Loma Rd Unit F1771245
- 0 Yucca Loma Rd Unit F1817469
- 0 Yucca Loma Rd Unit 273399
- 0 Yucca Loma Rd Unit 272342
- 0 Yucca Loma Rd Unit CRHD24087301
- 0 Yucca Loma Rd Unit CRHD24080744