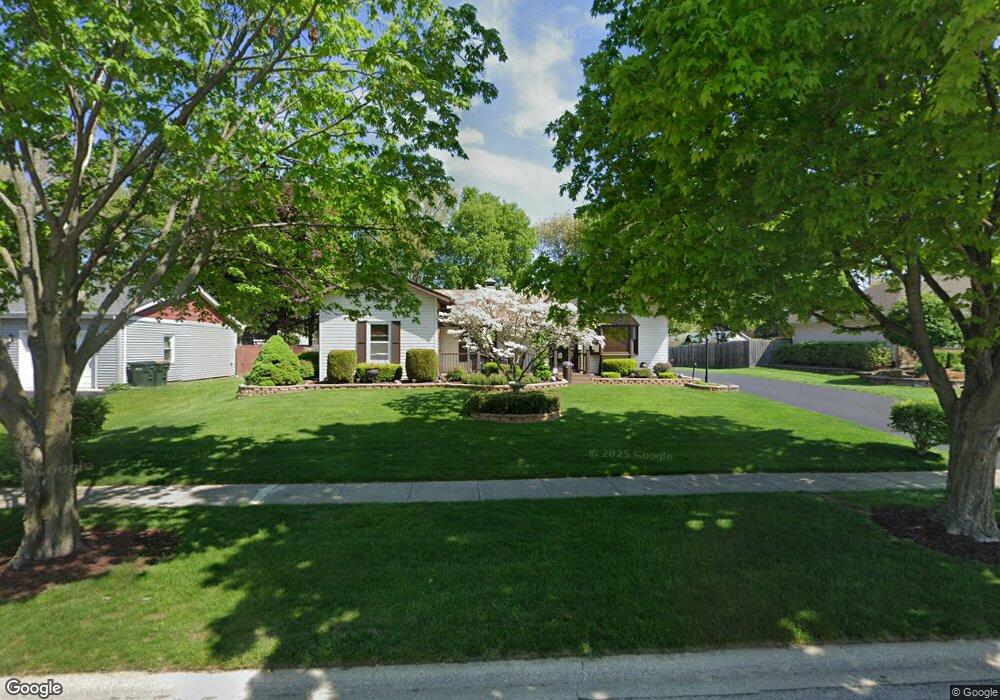
24314 W Hummingbird Dr Unit 2 Channahon, IL 60410
Estimated Value: $288,428 - $333,000
--
Bed
--
Bath
1,570
Sq Ft
$201/Sq Ft
Est. Value
About This Home
This home is located at 24314 W Hummingbird Dr Unit 2, Channahon, IL 60410 and is currently estimated at $316,107, approximately $201 per square foot. 24314 W Hummingbird Dr Unit 2 is a home located in Will County with nearby schools including N B Galloway Elementary School, Pioneer Path School, and Three Rivers School.
Ownership History
Date
Name
Owned For
Owner Type
Purchase Details
Closed on
Apr 3, 1998
Sold by
Firtik Michael E
Bought by
Rapp Dean R and Rapp Marian L
Current Estimated Value
Home Financials for this Owner
Home Financials are based on the most recent Mortgage that was taken out on this home.
Original Mortgage
$151,850
Outstanding Balance
$29,027
Interest Rate
7.18%
Mortgage Type
FHA
Estimated Equity
$287,080
Purchase Details
Closed on
Aug 21, 1996
Sold by
Firtik Brenda L and Woolington Brenda L
Bought by
Firtik Michael E
Purchase Details
Closed on
Mar 9, 1994
Sold by
Firtik Michael E
Bought by
Firtik Michael E and Firtik Brenda Lee
Home Financials for this Owner
Home Financials are based on the most recent Mortgage that was taken out on this home.
Original Mortgage
$70,000
Interest Rate
7.27%
Create a Home Valuation Report for This Property
The Home Valuation Report is an in-depth analysis detailing your home's value as well as a comparison with similar homes in the area
Home Values in the Area
Average Home Value in this Area
Purchase History
| Date | Buyer | Sale Price | Title Company |
|---|---|---|---|
| Rapp Dean R | $155,000 | Attorneys Title Guaranty Fun | |
| Firtik Michael E | -- | -- | |
| Firtik Michael E | -- | -- |
Source: Public Records
Mortgage History
| Date | Status | Borrower | Loan Amount |
|---|---|---|---|
| Open | Rapp Dean R | $151,850 | |
| Previous Owner | Firtik Michael E | $70,000 |
Source: Public Records
Tax History Compared to Growth
Tax History
| Year | Tax Paid | Tax Assessment Tax Assessment Total Assessment is a certain percentage of the fair market value that is determined by local assessors to be the total taxable value of land and additions on the property. | Land | Improvement |
|---|---|---|---|---|
| 2024 | $7,012 | $99,151 | $15,176 | $83,975 |
| 2023 | $7,012 | $85,357 | $13,382 | $71,975 |
| 2022 | $6,094 | $76,850 | $12,572 | $64,278 |
| 2021 | $5,695 | $72,637 | $11,883 | $60,754 |
| 2020 | $5,560 | $71,073 | $11,627 | $59,446 |
| 2019 | $5,504 | $70,850 | $11,100 | $59,750 |
| 2018 | $5,053 | $65,239 | $10,221 | $55,018 |
| 2017 | $4,709 | $60,046 | $9,795 | $50,251 |
| 2016 | $4,557 | $57,626 | $9,400 | $48,226 |
| 2015 | $4,550 | $53,200 | $8,400 | $44,800 |
| 2014 | $4,550 | $52,600 | $8,400 | $44,200 |
| 2013 | $4,550 | $58,600 | $8,400 | $50,200 |
Source: Public Records
Map
Nearby Homes
- 24241 W Hummingbird Dr
- 24415 W Quail Dr
- 24530 W Bluff Rd
- 24519 S Edwin Dr
- Sec8 W Eames St
- 24205 S Edwin Dr
- 24123 S Sandpiper Dr
- 25849 W Winding Hollow Dr
- 25930 W Winding Hollow Dr
- 25857 W Winding Hollow Dr
- 25865 W Winding Hollow Dr
- 25901 W Winding Hollow Dr
- 25905 W Winding Hollow Dr
- 25911 W Winding Hollow Dr
- 25200 S Westwind Dr
- 25156 S Westwind Dr
- 25203 S Westwind Dr
- 25127 S Westwind Dr
- Lot 123 W Cache Isle Cir
- Lot 120 W Cache Isle Cir
- 24306 W Hummingbird Dr
- 24322 W Hummingbird Dr
- 24330 W Hummingbird Dr
- 24300 W Hummingbird Dr
- 24451 S Valley Dr
- 24457 S Valley Dr
- 24445 S Valley Dr
- 24315 W Hummingbird Dr
- 24323 W Hummingbird Dr
- 24305 W Hummingbird Dr
- 24256 W Hummingbird Dr
- 24465 S Valley Dr Unit 1
- 24456 S Tree Ridge Ct
- 24348 W Hummingbird Dr
- 24452 S Tree Ridge Ct
- 24329 W Hummingbird Dr
- 24263 W Hummingbird Dr
- 24250 W Hummingbird Dr
- 24257 W Hummingbird Dr
- 24435 S Valley Dr