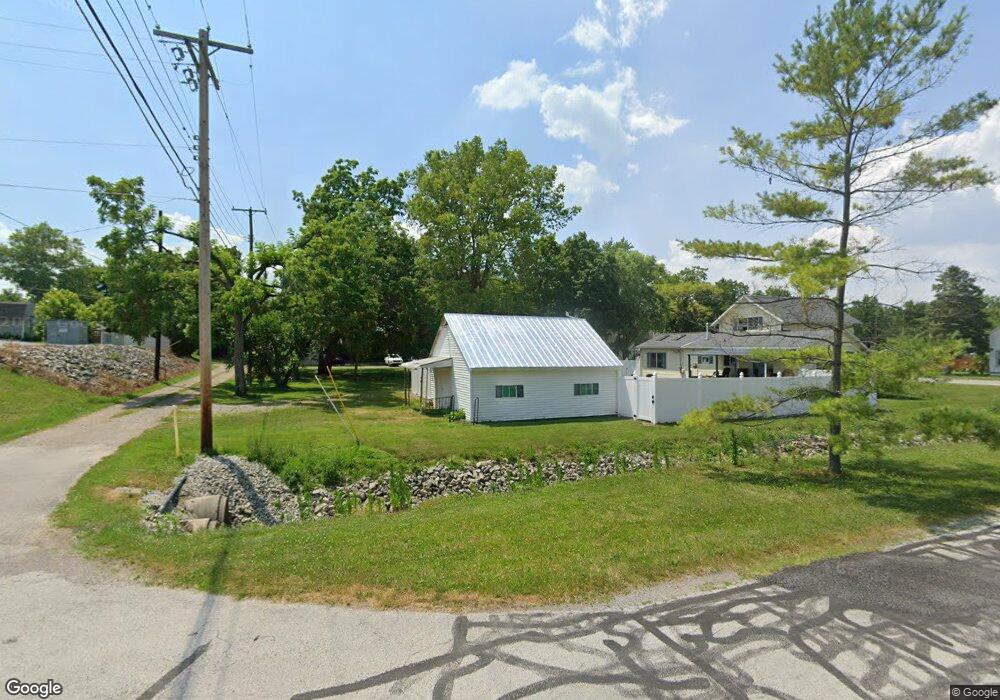
24317 2nd St Grand Rapids, OH 43522
Estimated Value: $174,000 - $220,000
3
Beds
2
Baths
1,364
Sq Ft
$149/Sq Ft
Est. Value
About This Home
This home is located at 24317 2nd St, Grand Rapids, OH 43522 and is currently estimated at $203,660, approximately $149 per square foot. 24317 2nd St is a home located in Wood County with nearby schools including Otsego Elementary School, Otsego Junior High School, and Otsego High School.
Ownership History
Date
Name
Owned For
Owner Type
Purchase Details
Closed on
May 17, 2024
Sold by
Ferow Paul and Ferow Alison
Bought by
Carr Ross L and Carr Sandra J
Current Estimated Value
Home Financials for this Owner
Home Financials are based on the most recent Mortgage that was taken out on this home.
Original Mortgage
$187,000
Outstanding Balance
$183,684
Interest Rate
6.88%
Mortgage Type
New Conventional
Estimated Equity
$19,976
Purchase Details
Closed on
Jul 28, 2017
Sold by
Vidon Louise
Bought by
Ferow Paul and Ferow Alison
Purchase Details
Closed on
Sep 16, 2011
Sold by
Smith Larry L
Bought by
Avidon Louise
Purchase Details
Closed on
Oct 23, 1998
Sold by
Schwartz Deborah Ruth and Resnick Deborah Ruth
Bought by
Smith Larry L
Home Financials for this Owner
Home Financials are based on the most recent Mortgage that was taken out on this home.
Original Mortgage
$43,000
Interest Rate
6%
Purchase Details
Closed on
Jan 15, 1991
Bought by
Brown Judith P
Create a Home Valuation Report for This Property
The Home Valuation Report is an in-depth analysis detailing your home's value as well as a comparison with similar homes in the area
Purchase History
We collect this data history from publicly available records. To have your information removed, we recommend requesting removal directly through your county’s website.
| Date | Buyer | Sale Price | Title Company |
|---|---|---|---|
| Carr Ross L | $210,000 | None Listed On Document | |
| Ferow Paul | $52,200 | None Available | |
| Avidon Louise | $32,000 | Attorney | |
| Smith Larry L | $63,000 | Louisville Title | |
| Brown Judith P | -- | -- |
Source: Public Records
Mortgage History
We collect this data history from publicly available records. To have your information removed, we recommend requesting removal directly through your county’s website.
| Date | Status | Borrower | Loan Amount |
|---|---|---|---|
| Open | Carr Ross L | $187,000 | |
| Previous Owner | Smith Larry L | $43,000 |
Source: Public Records
Tax History
| Year | Tax Paid | Tax Assessment Tax Assessment Total Assessment is a certain percentage of the fair market value that is determined by local assessors to be the total taxable value of land and additions on the property. | Land | Improvement |
|---|---|---|---|---|
| 2025 | $924 | $20,090 | $5,530 | $14,560 |
| 2024 | $919 | $20,090 | $5,530 | $14,560 |
| 2023 | $919 | $20,090 | $5,530 | $14,560 |
| 2021 | $896 | $17,640 | $5,250 | $12,390 |
| 2020 | $920 | $17,640 | $5,250 | $12,390 |
| 2019 | $838 | $15,930 | $5,250 | $10,680 |
| 2018 | $386 | $15,930 | $5,250 | $10,680 |
| 2017 | $87 | $15,930 | $5,250 | $10,680 |
| 2016 | $167 | $11,870 | $5,530 | $6,340 |
| 2015 | $173 | $11,870 | $5,530 | $6,340 |
| 2014 | $165 | $11,870 | $5,530 | $6,340 |
| 2013 | $73 | $11,270 | $5,250 | $6,020 |
Source: Public Records
Map
Nearby Homes
- 23763 Front St
- 23542 4th St
- 0 Manore Lot A Rd Unit 6130402
- 0 Manore Lot B Rd Unit 6130403
- 1298 County Road T3
- 9100 Providence-Neapolis-swanton Rd
- 13825 Bailey Rd
- 527 Catherine Dr
- 707 Catherine Dr
- 215 Reed St
- 245 N East St
- 234 N East St
- 11 Old Coach Rd
- 81 Back Bay Rd
- 77 Back Bay Rd
- 60 Back Bay Rd
- 0 Kellogg Rd Unit 6125521
- 0 W River Rd Unit 10000155
- 447 Washington St
- 6213 State Route 110
Your Personal Tour Guide
Ask me questions while you tour the home.