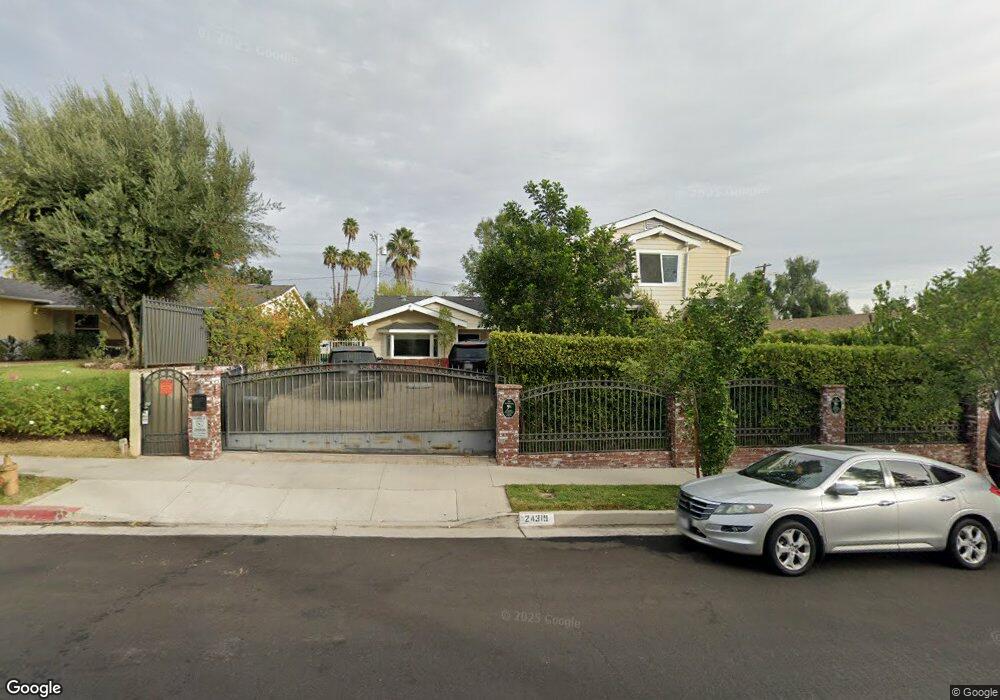
24319 Calvert St Woodland Hills, CA 91367
Estimated Value: $1,294,000 - $1,996,000
4
Beds
4
Baths
2,925
Sq Ft
$565/Sq Ft
Est. Value
About This Home
This home is located at 24319 Calvert St, Woodland Hills, CA 91367 and is currently estimated at $1,652,363, approximately $564 per square foot. 24319 Calvert St is a home located in Los Angeles County with nearby schools including Lockhurst Drive Charter Elementary, Haynes Charter For Enriched Studies, and Woodlake Elementary Community Charter.
Ownership History
Date
Name
Owned For
Owner Type
Purchase Details
Closed on
Feb 7, 2020
Sold by
Delava Robert and Delava Harinder
Bought by
Delava Robert and Delava Harinder
Current Estimated Value
Home Financials for this Owner
Home Financials are based on the most recent Mortgage that was taken out on this home.
Original Mortgage
$459,000
Outstanding Balance
$317,146
Interest Rate
3.72%
Mortgage Type
New Conventional
Estimated Equity
$1,335,217
Purchase Details
Closed on
Oct 6, 2016
Sold by
Delava Robert
Bought by
Delava Robert and Rai Harinder
Home Financials for this Owner
Home Financials are based on the most recent Mortgage that was taken out on this home.
Original Mortgage
$500,000
Interest Rate
3.46%
Mortgage Type
New Conventional
Purchase Details
Closed on
Apr 28, 1994
Sold by
Shimkus John
Bought by
Delava Robert
Home Financials for this Owner
Home Financials are based on the most recent Mortgage that was taken out on this home.
Original Mortgage
$189,900
Interest Rate
8.1%
Create a Home Valuation Report for This Property
The Home Valuation Report is an in-depth analysis detailing your home's value as well as a comparison with similar homes in the area
Home Values in the Area
Average Home Value in this Area
Purchase History
| Date | Buyer | Sale Price | Title Company |
|---|---|---|---|
| Delava Robert | -- | First American Title Company | |
| Delava Robert | -- | First American Title Company | |
| Delava Robert | $211,000 | Fidelity National Title Ins |
Source: Public Records
Mortgage History
| Date | Status | Borrower | Loan Amount |
|---|---|---|---|
| Open | Delava Robert | $459,000 | |
| Closed | Delava Robert | $500,000 | |
| Closed | Delava Robert | $189,900 |
Source: Public Records
Tax History Compared to Growth
Tax History
| Year | Tax Paid | Tax Assessment Tax Assessment Total Assessment is a certain percentage of the fair market value that is determined by local assessors to be the total taxable value of land and additions on the property. | Land | Improvement |
|---|---|---|---|---|
| 2025 | $6,540 | $511,473 | $165,358 | $346,115 |
| 2024 | $6,540 | $501,445 | $162,116 | $339,329 |
| 2023 | $6,421 | $491,614 | $158,938 | $332,676 |
| 2022 | $6,134 | $481,975 | $155,822 | $326,153 |
| 2021 | $6,048 | $472,525 | $152,767 | $319,758 |
| 2019 | $5,874 | $458,512 | $148,237 | $310,275 |
| 2018 | $5,717 | $449,523 | $145,331 | $304,192 |
| 2016 | $5,443 | $432,070 | $139,689 | $292,381 |
| 2015 | $5,022 | $298,382 | $137,591 | $160,791 |
| 2014 | $3,830 | $292,538 | $134,896 | $157,642 |
Source: Public Records
Map
Nearby Homes
- 24221 Aetna St
- 24244 Friar St
- 6171 Jared Ct
- 6009 Neddy Ave
- 24208 Gilmore St
- 24417 Clipstone St
- 5960 Pat Ave
- 5931 Neddy Ave
- 6022 Elba Place
- 6153 Debs Ave
- 5910 Pat Ave
- 6531 Neddy Ave
- 24415 Lemay St
- 5831 Elba Place
- 24686 Wooded Vista
- 5929 Adler Ave
- 5789 Fairhaven Ave
- 6703 Corie Ln
- 6146 County Oak Rd
- 5985 Vista de la Luz
- 24325 Calvert St
- 24313 Calvert St
- 24307 Calvert St
- 24331 Calvert St
- 24320 Calvert St
- 24330 Friar St
- 24324 Friar St
- 24310 Calvert St
- 24301 Calvert St
- 24339 Calvert St
- 24336 Friar St
- 24318 Friar St
- 24330 Calvert St
- 24342 Friar St
- 24300 Calvert St
- 24231 Calvert St
- 24312 Friar St
- 24345 Calvert St
- 24348 Friar St
- 24311 Bessemer St