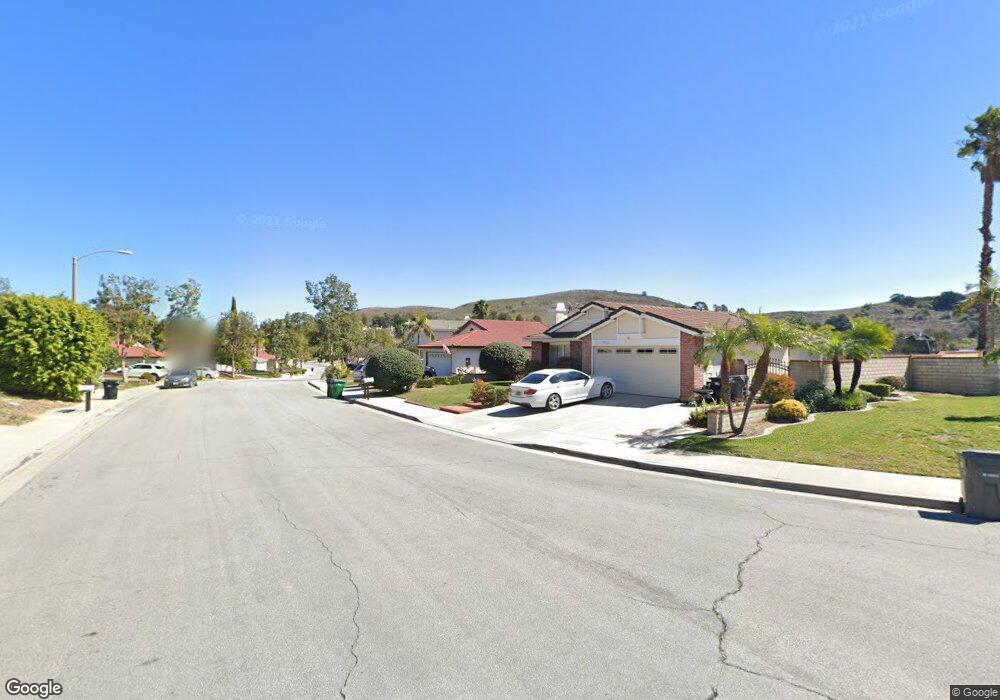
24320 Claywood Dr Diamond Bar, CA 91765
Estimated Value: $869,996 - $1,192,000
3
Beds
2
Baths
1,417
Sq Ft
$707/Sq Ft
Est. Value
About This Home
This home is located at 24320 Claywood Dr, Diamond Bar, CA 91765 and is currently estimated at $1,002,499, approximately $707 per square foot. 24320 Claywood Dr is a home located in Los Angeles County with nearby schools including Pantera Elementary School, Lorbeer Middle School, and Diamond Ranch High School.
Ownership History
Date
Name
Owned For
Owner Type
Purchase Details
Closed on
Sep 11, 2017
Sold by
Walgenbach Joseph P
Bought by
Walgenbach Joseph P and Joseph P Walgenbach Revocable
Current Estimated Value
Purchase Details
Closed on
Apr 24, 2000
Sold by
Wee Boon Y and Wee Francesca
Bought by
Walgenbach Joseph P
Home Financials for this Owner
Home Financials are based on the most recent Mortgage that was taken out on this home.
Original Mortgage
$160,000
Outstanding Balance
$54,776
Interest Rate
8.22%
Estimated Equity
$947,723
Purchase Details
Closed on
Aug 25, 1998
Sold by
Naipaul Gurpreet S and Naipaul Jagdeep K
Bought by
Wee Boon Yang and Wee Francesca
Home Financials for this Owner
Home Financials are based on the most recent Mortgage that was taken out on this home.
Original Mortgage
$168,000
Interest Rate
6.88%
Create a Home Valuation Report for This Property
The Home Valuation Report is an in-depth analysis detailing your home's value as well as a comparison with similar homes in the area
Home Values in the Area
Average Home Value in this Area
Purchase History
| Date | Buyer | Sale Price | Title Company |
|---|---|---|---|
| Walgenbach Joseph P | -- | None Available | |
| Walgenbach Joseph P | $229,000 | First American Title Co | |
| Wee Boon Yang | $210,000 | First American Title Co |
Source: Public Records
Mortgage History
| Date | Status | Borrower | Loan Amount |
|---|---|---|---|
| Open | Walgenbach Joseph P | $160,000 | |
| Previous Owner | Wee Boon Yang | $168,000 |
Source: Public Records
Tax History Compared to Growth
Tax History
| Year | Tax Paid | Tax Assessment Tax Assessment Total Assessment is a certain percentage of the fair market value that is determined by local assessors to be the total taxable value of land and additions on the property. | Land | Improvement |
|---|---|---|---|---|
| 2025 | $4,719 | $351,943 | $195,491 | $156,452 |
| 2024 | $4,719 | $345,043 | $191,658 | $153,385 |
| 2023 | $4,630 | $338,278 | $187,900 | $150,378 |
| 2022 | $4,556 | $331,646 | $184,216 | $147,430 |
| 2021 | $4,454 | $325,144 | $180,604 | $144,540 |
| 2019 | $4,543 | $315,502 | $175,249 | $140,253 |
| 2018 | $4,197 | $309,316 | $171,813 | $137,503 |
| 2016 | $3,940 | $297,307 | $165,143 | $132,164 |
| 2015 | $3,907 | $292,842 | $162,663 | $130,179 |
| 2014 | $3,883 | $287,106 | $159,477 | $127,629 |
Source: Public Records
Map
Nearby Homes
- 715 Pantera Dr
- 547 Bellows Ct
- 651 Radbury Place
- 683 Radbury Place
- 529 Bregante Dr
- 24471 Rockbury Dr
- 454 Ballena Dr
- 824 Leyland Dr
- 330 Ballena Dr
- 23855 Chinook Place
- 981 Silvertip Dr
- 959 Whitecliff Dr
- 23966 Decorah Rd
- 760 Featherwood Dr
- 23629 Golden Springs Dr Unit H-2
- 23617 Golden Springs Dr
- 23659 Golden Springs Dr Unit 3F
- 415 Charmingdale Rd
- 32 Franciscan Place
- 428 Golden Springs Dr Unit E
- 24312 Claywood Dr
- 24328 Claywood Dr
- 24331 Sentry Dr
- 24321 Sentry Dr
- 24306 Claywood Dr
- 24336 Claywood Dr
- 24321 Claywood Dr
- 24327 Claywood Dr
- 24315 Claywood Dr
- 24315 Sentry Dr
- 24333 Claywood Dr
- 24302 Claywood Dr
- 24307 Claywood Dr
- 24339 Claywood Dr
- 24309 Sentry Dr
- 602 Sky Ct
- 603 Sky Ct
- 24301 Claywood Dr
- 660 Pantera Dr
- 24300 Claywood Dr