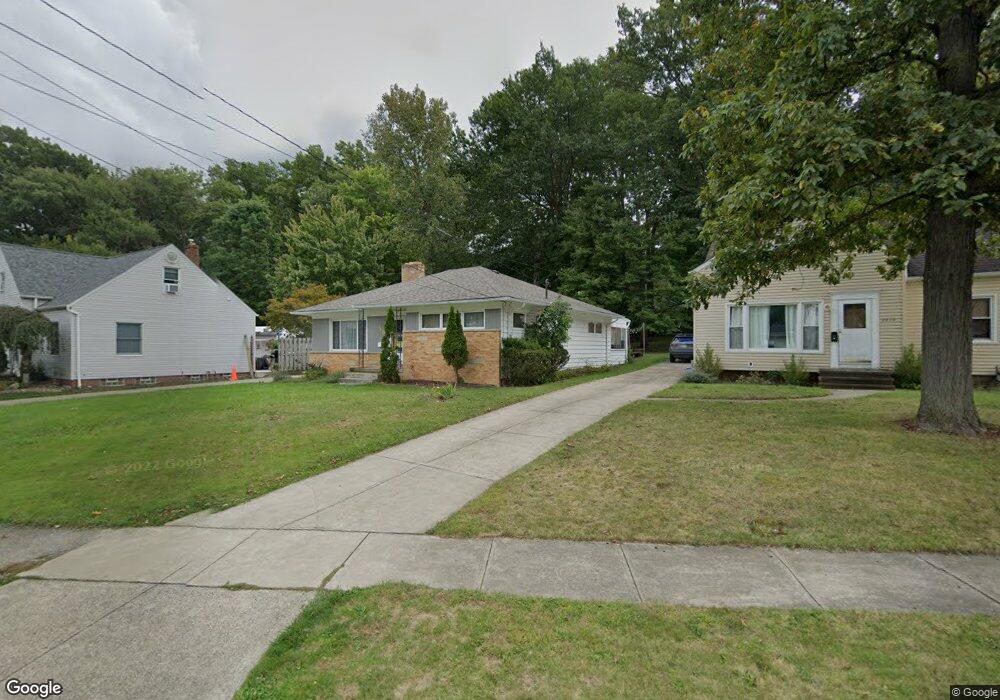
2433 Keystone Rd Cleveland, OH 44134
Estimated Value: $233,000 - $253,000
3
Beds
2
Baths
1,485
Sq Ft
$162/Sq Ft
Est. Value
About This Home
This home is located at 2433 Keystone Rd, Cleveland, OH 44134 and is currently estimated at $241,238, approximately $162 per square foot. 2433 Keystone Rd is a home located in Cuyahoga County with nearby schools including Shiloh Middle School, John Muir Elementary School, and Parma High School.
Ownership History
Date
Name
Owned For
Owner Type
Purchase Details
Closed on
Sep 24, 2018
Sold by
Mogilnicki Christopher and Mogilnicki Christine
Bought by
Hunt Megan A
Current Estimated Value
Home Financials for this Owner
Home Financials are based on the most recent Mortgage that was taken out on this home.
Original Mortgage
$111,925
Outstanding Balance
$97,404
Interest Rate
4.5%
Mortgage Type
FHA
Estimated Equity
$143,834
Purchase Details
Closed on
Oct 26, 2012
Sold by
Mogilnicki Phillip
Bought by
Mogilnicki Victor and Mogilnicki Christopher
Purchase Details
Closed on
Apr 5, 2007
Sold by
Estate Of Virginia T Mogilnicki
Bought by
Mogilnicki Victor and Mogilnicki Phillip
Purchase Details
Closed on
May 7, 1976
Sold by
Mogilnicki Victor S
Bought by
Mogilnicki Victor S
Purchase Details
Closed on
Jan 1, 1975
Bought by
Mogilnicki Victor S
Create a Home Valuation Report for This Property
The Home Valuation Report is an in-depth analysis detailing your home's value as well as a comparison with similar homes in the area
Home Values in the Area
Average Home Value in this Area
Purchase History
| Date | Buyer | Sale Price | Title Company |
|---|---|---|---|
| Hunt Megan A | $128,000 | None Available | |
| Mogilnicki Victor | -- | Attorney | |
| Mogilnicki Victor | -- | Attorney | |
| Mogilnicki Victor S | -- | -- | |
| Mogilnicki Victor S | -- | -- |
Source: Public Records
Mortgage History
| Date | Status | Borrower | Loan Amount |
|---|---|---|---|
| Open | Hunt Megan A | $111,925 |
Source: Public Records
Tax History Compared to Growth
Tax History
| Year | Tax Paid | Tax Assessment Tax Assessment Total Assessment is a certain percentage of the fair market value that is determined by local assessors to be the total taxable value of land and additions on the property. | Land | Improvement |
|---|---|---|---|---|
| 2024 | $4,121 | $67,935 | $14,280 | $53,655 |
| 2023 | $3,455 | $48,650 | $10,220 | $38,430 |
| 2022 | $3,423 | $48,650 | $10,220 | $38,430 |
| 2021 | $3,522 | $48,650 | $10,220 | $38,430 |
| 2020 | $3,265 | $39,870 | $8,370 | $31,500 |
| 2019 | $3,133 | $113,900 | $23,900 | $90,000 |
| 2018 | $3,070 | $39,870 | $8,370 | $31,500 |
| 2017 | $3,080 | $35,490 | $6,860 | $28,630 |
| 2016 | $3,063 | $35,490 | $6,860 | $28,630 |
| 2015 | $3,112 | $35,490 | $6,860 | $28,630 |
| 2014 | $3,112 | $38,160 | $7,390 | $30,770 |
Source: Public Records
Map
Nearby Homes
- 2821 Parklane Dr
- 2901 Wales Ave
- 2010 Grantwood Dr
- 2922 Commonwealth Dr
- 5850 S Park Blvd
- 1872 Valewood Dr
- 3226 Woodlawn Dr
- 3314 Commonwealth Dr
- 3325 Commonwealth Dr
- 3408 Parklane Dr
- 3205 George Ave
- 2907 Liggett Dr
- 3218 Somia Dr
- 3436 Heresford Dr
- 2811 Dellwood Dr
- 5961 Broadview Rd
- 3111 Liggett Dr
- 3122 Dellwood Dr
- 1417 Roanoke Dr
- 1414 Dartmoor Ave
- 2439 Keystone Rd
- 2429 Keystone Rd
- 2443 Keystone Rd
- 2423 Keystone Rd
- 2503 Keystone Rd
- 2419 Keystone Rd
- 2428 Wellington Ave
- 2507 Keystone Rd
- 2502 Wellington Ave
- 2413 Keystone Rd
- 2442 Keystone Rd
- 2502 Keystone Rd
- 2438 Keystone Rd
- 2511 Keystone Rd
- 2506 Keystone Rd
- 2412 Wellington Ave
- 2432 Keystone Rd
- 2409 Keystone Rd
- 2510 Keystone Rd
- 2428 Keystone Rd