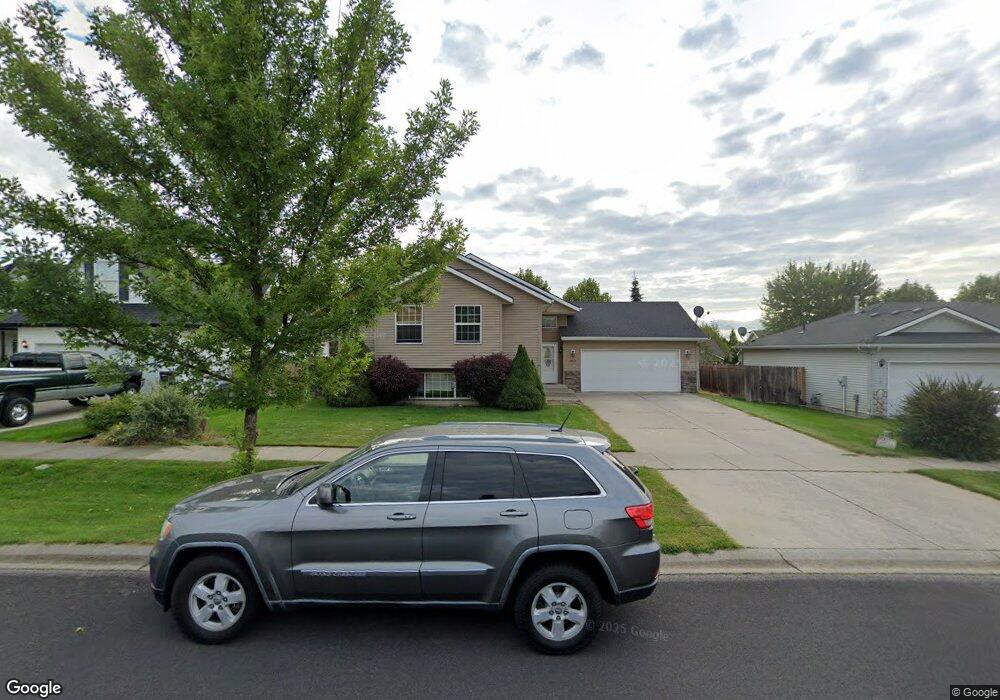
2433 N Sparrow Loop Post Falls, ID 83854
North Prairie NeighborhoodEstimated Value: $532,000 - $580,000
4
Beds
3
Baths
2,508
Sq Ft
$218/Sq Ft
Est. Value
About This Home
This home is located at 2433 N Sparrow Loop, Post Falls, ID 83854 and is currently estimated at $547,933, approximately $218 per square foot. 2433 N Sparrow Loop is a home located in Kootenai County with nearby schools including Prairie View Elementary School, Post Falls Middle School, and Post Falls High School.
Ownership History
Date
Name
Owned For
Owner Type
Purchase Details
Closed on
Mar 26, 2018
Sold by
Gates David and Gates Laurie
Bought by
Caraway Nicholas and Caraway Linda A
Current Estimated Value
Home Financials for this Owner
Home Financials are based on the most recent Mortgage that was taken out on this home.
Original Mortgage
$294,405
Outstanding Balance
$250,626
Interest Rate
4.38%
Mortgage Type
VA
Estimated Equity
$297,307
Purchase Details
Closed on
Aug 22, 2017
Sold by
Archer Jill M
Bought by
Spencer Timothy J and Spencer Kelly J
Home Financials for this Owner
Home Financials are based on the most recent Mortgage that was taken out on this home.
Original Mortgage
$480,000
Interest Rate
4.03%
Mortgage Type
Unknown
Purchase Details
Closed on
Aug 10, 2006
Sold by
Hallmark Homes Inc
Bought by
Rice Bradley R and Rice Jena N
Create a Home Valuation Report for This Property
The Home Valuation Report is an in-depth analysis detailing your home's value as well as a comparison with similar homes in the area
Home Values in the Area
Average Home Value in this Area
Purchase History
| Date | Buyer | Sale Price | Title Company |
|---|---|---|---|
| Caraway Nicholas | -- | Titleone | |
| Spencer Timothy J | -- | Alliance Title & Escrow | |
| Rice Bradley R | -- | -- |
Source: Public Records
Mortgage History
| Date | Status | Borrower | Loan Amount |
|---|---|---|---|
| Open | Caraway Nicholas | $294,405 | |
| Previous Owner | Spencer Timothy J | $480,000 |
Source: Public Records
Tax History
| Year | Tax Paid | Tax Assessment Tax Assessment Total Assessment is a certain percentage of the fair market value that is determined by local assessors to be the total taxable value of land and additions on the property. | Land | Improvement |
|---|---|---|---|---|
| 2025 | $2,990 | $499,590 | $175,000 | $324,590 |
| 2024 | $2,940 | $470,060 | $152,000 | $318,060 |
| 2023 | $2,940 | $503,505 | $160,000 | $343,505 |
| 2022 | $3,301 | $539,172 | $157,500 | $381,672 |
| 2021 | $3,414 | $340,220 | $105,000 | $235,220 |
| 2020 | $3,385 | $298,730 | $90,000 | $208,730 |
| 2019 | $3,516 | $280,460 | $90,000 | $190,460 |
| 2018 | $2,026 | $243,700 | $70,000 | $173,700 |
| 2017 | $1,846 | $219,500 | $50,000 | $169,500 |
| 2016 | $1,731 | $200,470 | $40,000 | $160,470 |
| 2015 | $1,799 | $198,040 | $37,000 | $161,040 |
| 2013 | $1,561 | $167,410 | $32,000 | $135,410 |
Source: Public Records
Map
Nearby Homes
- 2444 N Sparrow Loop
- 4350 E Bogie Dr
- 4184 E Bogie Dr
- 4226 E Bogie Dr
- 4398 E Bogie Dr
- 4314 E Bogie Dr
- 4264 E Bogie Dr
- 4440 E Bogie Dr
- 3648 White Sands Ln
- 2593 E Natti Ct
- 2613 E Cinder Ave
- 2651 E Cinder Ave
- 2826 N Charlene Kelsy St
- 3154 E Thrush
- 2707 N Neptune St
- 2725 N Neptune St
- 2902 N Charlene Kelsy St
- 1988 E Dipper Loop
- 2925 N Neptune St
- 2660 N Neptune St
- 2433 Sparrow Loop
- 2419 Sparrow Loop
- 2441 N Sparrow Loop
- 2441 Sparrow Loop
- 2449 Sparrow Loop
- 2449 N Sparrow Loop
- 2675 Sparrow Loop
- 2691 N Sparrow Loop
- 2667 N Sparrow Loop
- 2432 N Sparrow Loop
- 2422 N Sparrow Loop
- 2422 Sparrow Loop
- 2655 N Sparrow Loop
- 2461 Sparrow Loop
- 2461 N Sparrow Loop
- 2444 Sparrow Loop
- 2412 N Sparrow Loop
- 2454 N Sparrow Loop
- 2454 Sparrow Loop
- 2645 N Sparrow Loop
Your Personal Tour Guide
Ask me questions while you tour the home.