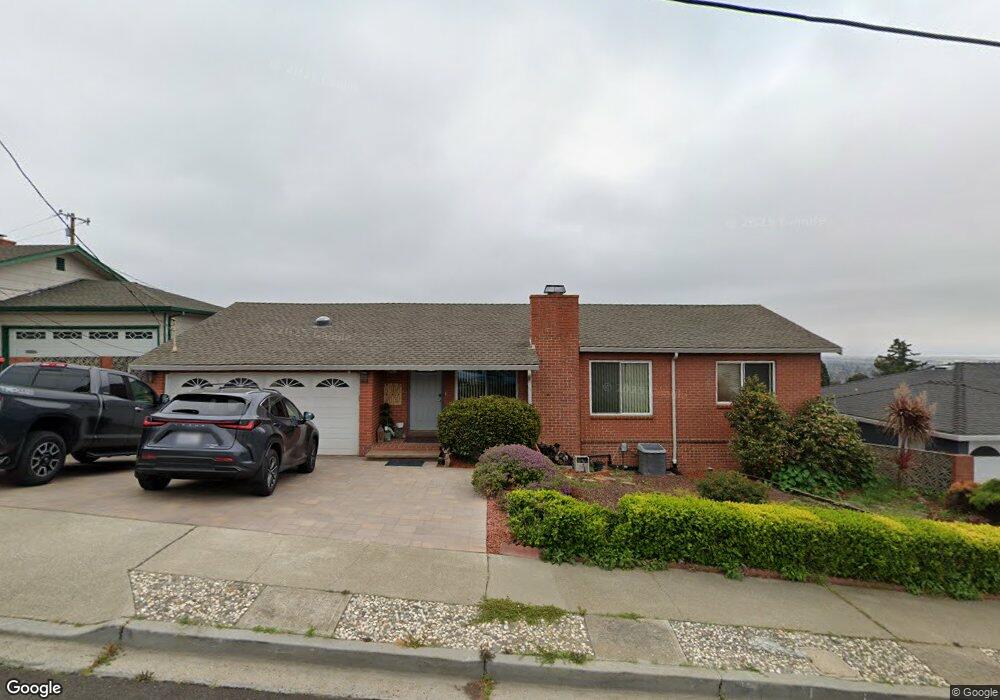
2434 Prosperity Way San Leandro, CA 94578
West Castro Valley NeighborhoodEstimated Value: $713,000 - $880,000
3
Beds
2
Baths
1,290
Sq Ft
$642/Sq Ft
Est. Value
About This Home
This home is located at 2434 Prosperity Way, San Leandro, CA 94578 and is currently estimated at $828,080, approximately $641 per square foot. 2434 Prosperity Way is a home located in Alameda County with nearby schools including Corvallis Elementary School, Edendale Middle, and San Lorenzo High School.
Ownership History
Date
Name
Owned For
Owner Type
Purchase Details
Closed on
Jan 14, 2013
Sold by
Yakovlev Viktor Petrovich and Yakovlev Nadezhda Vasilyevna
Bought by
Yakovlev Viktor Petrovich and Yakovlev Nadezhda Vasilyevna
Current Estimated Value
Home Financials for this Owner
Home Financials are based on the most recent Mortgage that was taken out on this home.
Original Mortgage
$255,000
Outstanding Balance
$177,053
Interest Rate
3.34%
Mortgage Type
New Conventional
Estimated Equity
$651,027
Purchase Details
Closed on
Dec 16, 1997
Sold by
Yakovlev Victor and Yakovleva Nadezhda
Bought by
Yakovlev Victor and Yakovleva Nadezhda
Purchase Details
Closed on
Apr 22, 1997
Sold by
Henriques Laura M and Henriques Andrea
Bought by
Yakovlev Victor and Yakovleva Nadezhda V
Home Financials for this Owner
Home Financials are based on the most recent Mortgage that was taken out on this home.
Original Mortgage
$181,450
Interest Rate
7.86%
Create a Home Valuation Report for This Property
The Home Valuation Report is an in-depth analysis detailing your home's value as well as a comparison with similar homes in the area
Home Values in the Area
Average Home Value in this Area
Purchase History
| Date | Buyer | Sale Price | Title Company |
|---|---|---|---|
| Yakovlev Viktor Petrovich | -- | First American Title | |
| Yakovlev Victor | -- | -- | |
| Yakovlev Victor | $191,000 | Chicago Title Co |
Source: Public Records
Mortgage History
| Date | Status | Borrower | Loan Amount |
|---|---|---|---|
| Open | Yakovlev Viktor Petrovich | $255,000 | |
| Previous Owner | Yakovlev Victor | $181,450 |
Source: Public Records
Tax History Compared to Growth
Tax History
| Year | Tax Paid | Tax Assessment Tax Assessment Total Assessment is a certain percentage of the fair market value that is determined by local assessors to be the total taxable value of land and additions on the property. | Land | Improvement |
|---|---|---|---|---|
| 2025 | $4,220 | $304,060 | $93,318 | $217,742 |
| 2024 | $4,220 | $297,961 | $91,488 | $213,473 |
| 2023 | $4,194 | $298,983 | $89,695 | $209,288 |
| 2022 | $4,100 | $286,121 | $87,936 | $205,185 |
| 2021 | $3,981 | $280,374 | $86,212 | $201,162 |
| 2020 | $3,871 | $284,428 | $85,328 | $199,100 |
| 2019 | $3,913 | $278,853 | $83,656 | $195,197 |
| 2018 | $3,798 | $273,387 | $82,016 | $191,371 |
| 2017 | $3,695 | $268,027 | $80,408 | $187,619 |
| 2016 | $3,511 | $262,773 | $78,832 | $183,941 |
| 2015 | $3,300 | $258,827 | $77,648 | $181,179 |
| 2014 | $3,272 | $253,758 | $76,127 | $177,631 |
Source: Public Records
Map
Nearby Homes
- 16265 Lyle St
- 2317 Prosperity Way
- 19100 Crest Ave Unit 30
- 19100 Crest Ave Unit 23
- 19100 Crest Ave Unit 100
- 16274 San Remo Dr
- 2500 Miramar Ave Unit 203
- 2500 Miramar Ave Unit 101
- 18871 Stanton Ave
- 2505 Miramar Ave Unit 122
- 2250 Strang Ave
- 18760 Stanton Ave
- 18675 Stanton Ave
- 16560 Cowell St
- 18623 Laredo Rd
- 16085 Gramercy Dr
- 0 Lindview Dr
- 16504 Page St
- 16068 Gramercy Dr
- 0 Miramonte Ave Unit 41107168
- 19081 Crest Ave
- 2458 Prosperity Way
- 2422 Prosperity Way
- 2414 Prosperity Way
- 19083 Crest Ave
- 2441 Prosperity Way
- 2429 Prosperity Way
- 2464 Prosperity Way
- 16320 Panoramic Way
- 2457 Prosperity Way
- 2419 Prosperity Way
- 2400 Prosperity Way
- 19087 Crest Ave
- 19085 Crest Ave
- 16340 Panoramic Way
- 2411 Prosperity Way
- 16289 Lyle St
- 2476 Prosperity Way
- 2446 Lyle Ct
- 2438 Lyle Ct