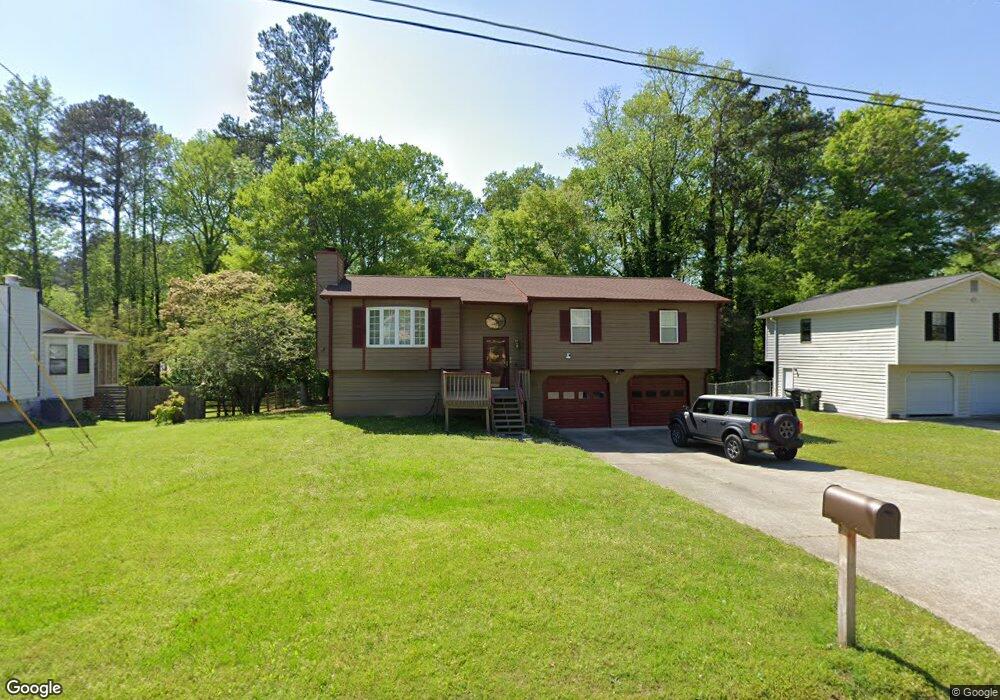
2435 Justin Dr SW Marietta, GA 30064
Estimated Value: $327,000 - $354,000
3
Beds
2
Baths
1,340
Sq Ft
$256/Sq Ft
Est. Value
About This Home
This home is located at 2435 Justin Dr SW, Marietta, GA 30064 and is currently estimated at $343,093, approximately $256 per square foot. 2435 Justin Dr SW is a home located in Cobb County with nearby schools including Hollydale Elementary School, Smitha Middle School, and Osborne High School.
Ownership History
Date
Name
Owned For
Owner Type
Purchase Details
Closed on
Sep 22, 2023
Sold by
Gresham Carol E
Bought by
Gresham Carol E and Anderson Rhonda
Current Estimated Value
Home Financials for this Owner
Home Financials are based on the most recent Mortgage that was taken out on this home.
Original Mortgage
$227,250
Interest Rate
7.23%
Mortgage Type
New Conventional
Purchase Details
Closed on
Jul 8, 2022
Sold by
Gresham Carol E
Bought by
Gresham Carol E
Home Financials for this Owner
Home Financials are based on the most recent Mortgage that was taken out on this home.
Original Mortgage
$178,062
Interest Rate
5.23%
Mortgage Type
New Conventional
Create a Home Valuation Report for This Property
The Home Valuation Report is an in-depth analysis detailing your home's value as well as a comparison with similar homes in the area
Home Values in the Area
Average Home Value in this Area
Purchase History
| Date | Buyer | Sale Price | Title Company |
|---|---|---|---|
| Gresham Carol E | -- | None Listed On Document | |
| Gresham Carol E | -- | None Listed On Document |
Source: Public Records
Mortgage History
| Date | Status | Borrower | Loan Amount |
|---|---|---|---|
| Previous Owner | Gresham Carol E | $227,250 | |
| Previous Owner | Gresham Carol E | $178,062 |
Source: Public Records
Tax History Compared to Growth
Tax History
| Year | Tax Paid | Tax Assessment Tax Assessment Total Assessment is a certain percentage of the fair market value that is determined by local assessors to be the total taxable value of land and additions on the property. | Land | Improvement |
|---|---|---|---|---|
| 2025 | $611 | $136,804 | $20,000 | $116,804 |
| 2024 | $614 | $136,804 | $20,000 | $116,804 |
| 2023 | $356 | $119,488 | $20,000 | $99,488 |
| 2022 | $432 | $72,012 | $12,000 | $60,012 |
| 2021 | $432 | $72,012 | $12,000 | $60,012 |
| 2020 | $432 | $72,012 | $12,000 | $60,012 |
| 2019 | $397 | $60,368 | $8,000 | $52,368 |
| 2018 | $397 | $60,368 | $8,000 | $52,368 |
| 2017 | $325 | $49,144 | $8,000 | $41,144 |
| 2016 | $328 | $49,144 | $8,000 | $41,144 |
| 2015 | $326 | $41,784 | $8,000 | $33,784 |
| 2014 | $297 | $34,252 | $0 | $0 |
Source: Public Records
Map
Nearby Homes
- 2448 Wood Meadows Dr SW
- 2450 Horseshoe Bend Rd SW
- 2318 Powder Springs Rd SW
- 2614 Smith Ave SW
- 2554 Red Barn Rd SW
- 0 Red Barn Rd SW Unit 7583499
- 0 Red Barn Rd SW Unit 10526807
- 2720 Cold Springs Trail SW
- 2730 Hembree Rd SW
- 2608 Foxwood Place SW Unit IV
- 3614 Josh Ct
- 3112 Patriot Square SW
- 3100 Patriot Square SW
- 2723 Horseshoe Creek Dr SW
- 2626 Smith Ave SW
- 2599 Candler Way SW
- 2625 Deerfield Cir SW
- 2672 Holmes Mill Place SW
- 3106 Yellowhammer Dr Unit 28
- 2437 Justin Dr SW
- 2433 Justin Dr SW
- 2470 Justin Ct SW
- 2441 Justin Dr SW Unit 1
- 2431 Justin Dr SW Unit 2
- 2428 Justin Dr SW
- 2436 Justin Dr SW Unit 1
- 2449 Wood Meadows Dr SW Unit 2449
- 2449 Wood Meadows Dr SW
- 2447 Wood Meadows Dr SW
- 2443 Wood Meadows Dr SW
- 2445 Wood Meadows Dr SW
- 2460 Justin Ct SW Unit 2
- 2429 Justin Dr SW
- 2461 Justin Ct SW
- 2451 Wood Meadows Dr SW
- 2442 Wood Meadows Dr SW Unit 1
- 2453 Wood Meadows Dr SW
- 2440 Wood Meadows Dr SW
- 2433 Wood Meadows Dr SW