
Seller's Agent in 2018
Laura Benson
Coldwell Banker Realty
(513) 312-6429
106 Total Sales

Estimated Value: $190,000 - $217,000
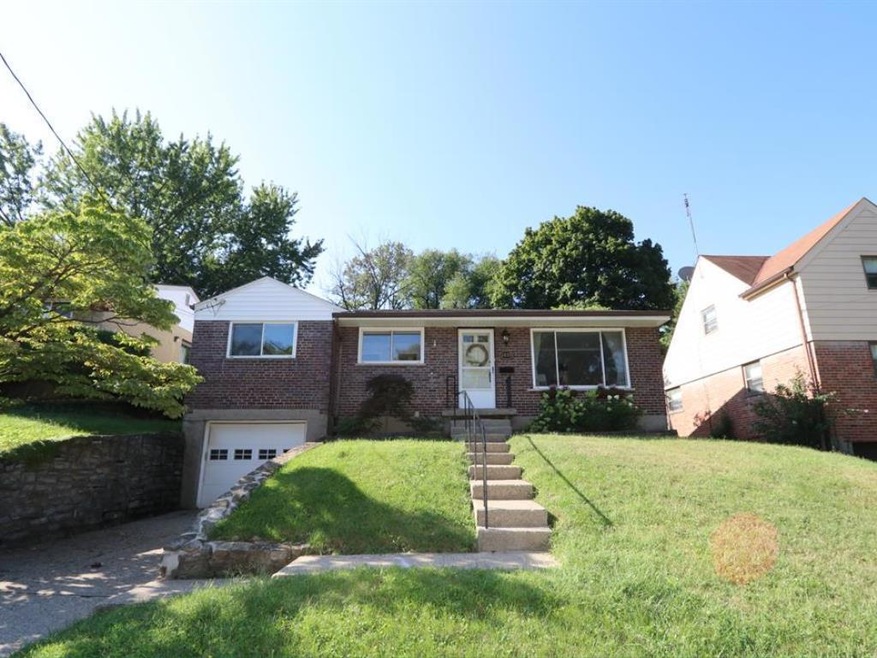
Well maintained brick Ranch that has plenty of charm. Updated bathroom and 3 spacious bedrooms. Located on a no-outlet street! Brand new stove and newly painted garage! Sliding glass door replaced in '17. A must see!
Last Agent to Sell the Property
Coldwell Banker Realty License #2017001238 Listed on: 09/04/2018
We collect this data history from publicly available records. To have your information removed, we recommend requesting removal directly through your county’s website.
We collect this data history from publicly available records. To have your information removed, we recommend requesting removal directly through your county’s website.
| Date | Buyer | Sale Price | Title Company |
|---|---|---|---|
| $109,000 | None Available | ||
| $76,800 | Attorney |
We collect this data history from publicly available records. To have your information removed, we recommend requesting removal directly through your county’s website.
| Date | Status | Borrower | Loan Amount |
|---|---|---|---|
| Previous Owner | $71,407 |
We collect this data history from publicly available records. To have your information removed, we recommend requesting removal directly through your county’s website.
| Date | Event | Price | List to Sale | Price per Sq Ft |
|---|---|---|---|---|
| 12/25/2018 12/25/18 | Off Market | $109,000 | -- | -- |
| 09/26/2018 09/26/18 | Sold | $109,000 | -9.2% | $106 / Sq Ft |
| 09/20/2018 09/20/18 | Pending | -- | -- | -- |
| 09/04/2018 09/04/18 | For Sale | $120,000 | -- | $117 / Sq Ft |
We collect this data history from publicly available records. To have your information removed, we recommend requesting removal directly through your county’s website.
| Year | Tax Paid | Tax Assessment Tax Assessment Total Assessment is a certain percentage of the fair market value that is determined by local assessors to be the total taxable value of land and additions on the property. | Land | Improvement |
|---|---|---|---|---|
| 2025 | $3,373 | $45,794 | $11,193 | $34,601 |
| 2024 | $3,369 | $45,794 | $11,193 | $34,601 |
| 2023 | $3,374 | $45,794 | $11,193 | $34,601 |
| 2022 | $3,583 | $38,151 | $9,034 | $29,117 |
| 2021 | $3,560 | $38,151 | $9,034 | $29,117 |
| 2020 | $3,531 | $38,151 | $9,034 | $29,117 |
| 2019 | $2,944 | $27,955 | $7,994 | $19,961 |
| 2018 | $2,788 | $27,955 | $7,994 | $19,961 |
| 2017 | $2,710 | $27,955 | $7,994 | $19,961 |
| 2016 | $2,528 | $25,806 | $8,187 | $17,619 |
| 2015 | $2,354 | $25,806 | $8,187 | $17,619 |
| 2014 | $2,237 | $25,806 | $8,187 | $17,619 |
| 2013 | $2,353 | $26,880 | $8,526 | $18,354 |
Seller's Agent in 2018
Laura Benson
Coldwell Banker Realty
(513) 312-6429
106 Total Sales
Buyer's Agent in 2018
Kelly Gibbs
Comey & Shepherd
(513) 290-6216
1 in this area
131 Total Sales
Source: MLS of Greater Cincinnati (CincyMLS)
MLS Number: 1594740
APN: 528-0003-0313
Disclaimer: Certain information contained herein is derived from information provided by parties other than Homes.com. All information provided is deemed reliable, but is not guaranteed to be accurate and should be independently verified.
![]() The data relating to real estate for sale on this website comes in part from the Broker Reciprocity programs of the MLS of Greater Cincinnati, Inc.. Those listings held by brokerage firms other than Ten-X are marked with the Broker Reciprocity logo and house icon. The properties displayed may not be all of the properties available through Broker Reciprocity.
The data relating to real estate for sale on this website comes in part from the Broker Reciprocity programs of the MLS of Greater Cincinnati, Inc.. Those listings held by brokerage firms other than Ten-X are marked with the Broker Reciprocity logo and house icon. The properties displayed may not be all of the properties available through Broker Reciprocity.
IDX information is provided exclusively for personal, non-commercial use, and may not be used for any purpose other than to identify prospective properties consumers may be interested in purchasing.
Information is deemed reliable but not guaranteed.
Ten-X does not display the entire Cincinnati MLS Broker Reciprocity™ database on this web site. The listings of some real estate brokerage firms have been excluded.
Copyright 2026, MLS of Greater Cincinnati, Inc. All rights reserved
Ask me questions while you tour the home.