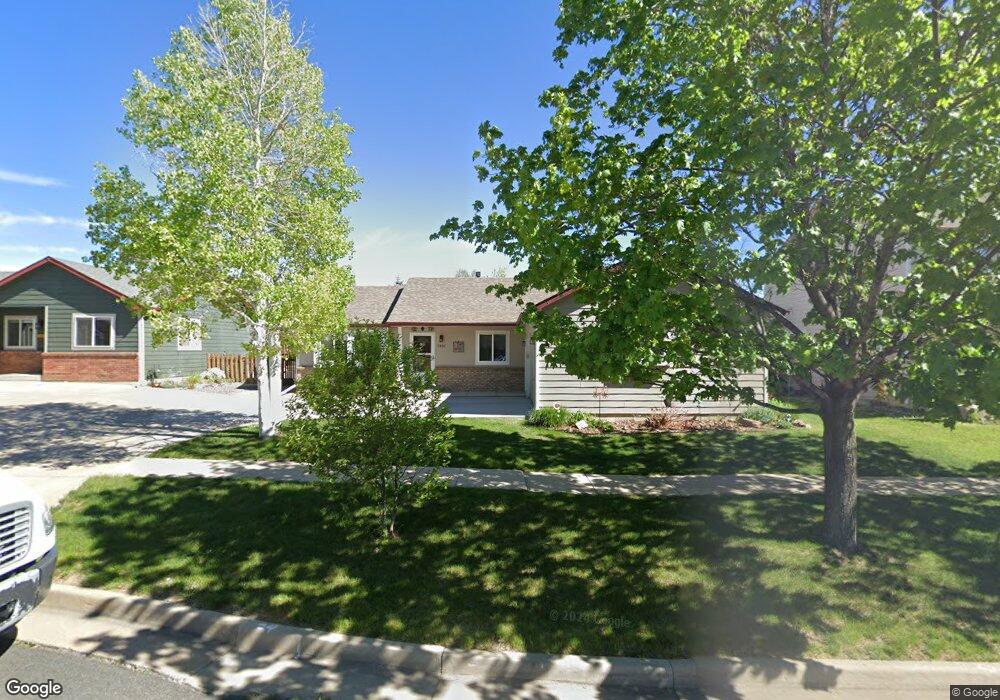
2435 W 44th St Loveland, CO 80538
Estimated Value: $450,000 - $462,000
3
Beds
2
Baths
1,180
Sq Ft
$386/Sq Ft
Est. Value
About This Home
This home is located at 2435 W 44th St, Loveland, CO 80538 and is currently estimated at $456,021, approximately $386 per square foot. 2435 W 44th St is a home located in Larimer County with nearby schools including Centennial Elementary School, Lucile Erwin Middle School, and Loveland High School.
Ownership History
Date
Name
Owned For
Owner Type
Purchase Details
Closed on
Sep 30, 1997
Sold by
Mountain Vista Builders Inc
Bought by
Carson Mark D and Carson Kimberly K
Current Estimated Value
Home Financials for this Owner
Home Financials are based on the most recent Mortgage that was taken out on this home.
Original Mortgage
$79,155
Outstanding Balance
$12,762
Interest Rate
7.49%
Estimated Equity
$443,259
Purchase Details
Closed on
Aug 5, 1997
Sold by
Vista Ii Development Corp
Bought by
Mountain Vista Builders Inc
Home Financials for this Owner
Home Financials are based on the most recent Mortgage that was taken out on this home.
Original Mortgage
$79,155
Outstanding Balance
$12,762
Interest Rate
7.49%
Estimated Equity
$443,259
Purchase Details
Closed on
Aug 4, 1997
Sold by
Greenspan R Russell and Greenspan Ruth
Bought by
Vista Ii Development Corp
Home Financials for this Owner
Home Financials are based on the most recent Mortgage that was taken out on this home.
Original Mortgage
$79,155
Outstanding Balance
$12,762
Interest Rate
7.49%
Estimated Equity
$443,259
Create a Home Valuation Report for This Property
The Home Valuation Report is an in-depth analysis detailing your home's value as well as a comparison with similar homes in the area
Home Values in the Area
Average Home Value in this Area
Purchase History
| Date | Buyer | Sale Price | Title Company |
|---|---|---|---|
| Carson Mark D | $129,155 | Land Title | |
| Mountain Vista Builders Inc | $27,000 | Land Title | |
| Vista Ii Development Corp | -- | Land Title |
Source: Public Records
Mortgage History
| Date | Status | Borrower | Loan Amount |
|---|---|---|---|
| Open | Carson Mark D | $79,155 |
Source: Public Records
Tax History Compared to Growth
Tax History
| Year | Tax Paid | Tax Assessment Tax Assessment Total Assessment is a certain percentage of the fair market value that is determined by local assessors to be the total taxable value of land and additions on the property. | Land | Improvement |
|---|---|---|---|---|
| 2025 | $2,207 | $31,336 | $1,910 | $29,426 |
| 2024 | $2,128 | $31,336 | $1,910 | $29,426 |
| 2022 | $1,941 | $24,395 | $1,981 | $22,414 |
| 2021 | $1,995 | $25,097 | $2,038 | $23,059 |
| 2020 | $1,953 | $24,568 | $2,038 | $22,530 |
| 2019 | $1,920 | $24,568 | $2,038 | $22,530 |
| 2018 | $1,451 | $17,633 | $2,052 | $15,581 |
| 2017 | $1,247 | $17,590 | $2,052 | $15,538 |
| 2016 | $1,190 | $16,231 | $2,269 | $13,962 |
| 2015 | $1,181 | $16,230 | $2,270 | $13,960 |
| 2014 | $1,041 | $13,840 | $2,270 | $11,570 |
Source: Public Records
Map
Nearby Homes
- 4559 Keota Place
- 2250 W 44th St
- 2554 W 44th St
- 2643 W 45th St
- 2597 W 46th St
- 2684 W 46th St
- 2465 Glen Isle Dr
- 2070 Tonopas Ct
- 3902 Penrose Ave
- 3890 Kremmling Dr
- 2349 Paonia St
- 2308 Winter Park St
- 2015 Massachusetts St
- 2960 Kincaid Dr Unit 303
- 4719 Degas Dr
- 4725 Degas Dr
- 4733 Degas Dr
- 4745 Degas Dr
- 4790 Degas Dr
- 2920 Donatello St