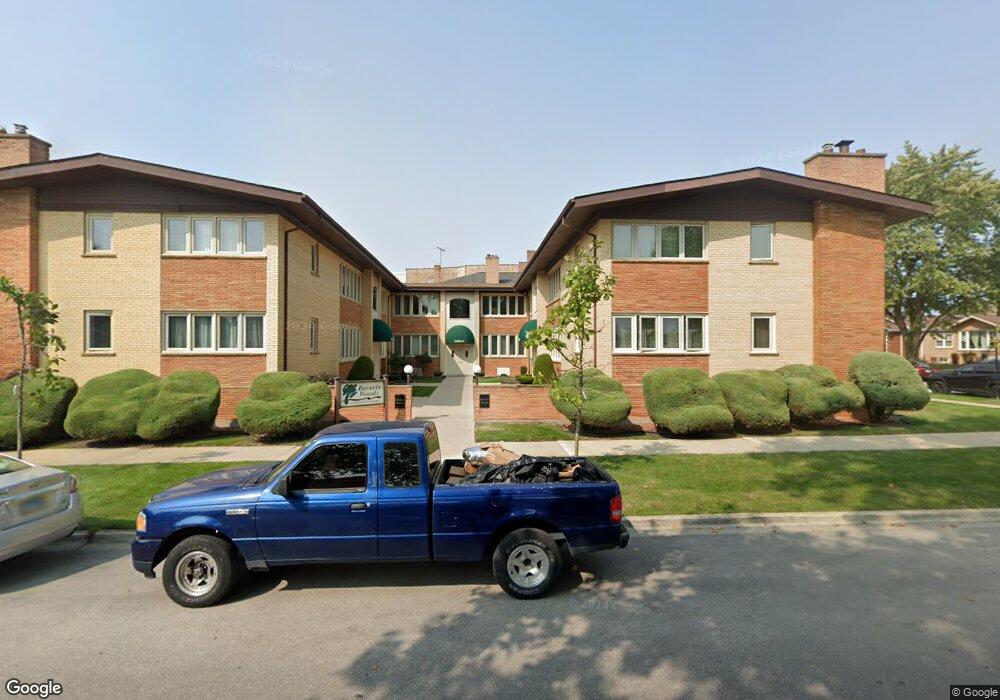
2436 W 117th St Unit 2 Chicago, IL 60655
Morgan Park NeighborhoodEstimated Value: $142,845 - $202,000
2
Beds
1
Bath
20,016
Sq Ft
$8/Sq Ft
Est. Value
About This Home
This home is located at 2436 W 117th St Unit 2, Chicago, IL 60655 and is currently estimated at $165,461, approximately $8 per square foot. 2436 W 117th St Unit 2 is a home located in Cook County with nearby schools including Clissold Elementary School, Morgan Park High School, and St Walter School.
Ownership History
Date
Name
Owned For
Owner Type
Purchase Details
Closed on
Mar 15, 2004
Sold by
Edwards Todd
Bought by
Jackson Dorothy J
Current Estimated Value
Home Financials for this Owner
Home Financials are based on the most recent Mortgage that was taken out on this home.
Original Mortgage
$115,900
Outstanding Balance
$52,201
Interest Rate
5.48%
Mortgage Type
Purchase Money Mortgage
Estimated Equity
$113,260
Purchase Details
Closed on
May 28, 2002
Sold by
Estate Of Gwendolyn Perkins
Bought by
Edwards Todd
Purchase Details
Closed on
May 24, 2000
Sold by
Fields Rita K
Bought by
Perkins Gwendolyn L
Home Financials for this Owner
Home Financials are based on the most recent Mortgage that was taken out on this home.
Original Mortgage
$85,845
Interest Rate
8.14%
Mortgage Type
Purchase Money Mortgage
Purchase Details
Closed on
Oct 29, 1996
Sold by
Standard Bank & Trust Company
Bought by
Weidemiller Anita and Fields Rita K
Create a Home Valuation Report for This Property
The Home Valuation Report is an in-depth analysis detailing your home's value as well as a comparison with similar homes in the area
Home Values in the Area
Average Home Value in this Area
Purchase History
| Date | Buyer | Sale Price | Title Company |
|---|---|---|---|
| Jackson Dorothy J | -- | Multiple | |
| Edwards Todd | -- | -- | |
| Perkins Gwendolyn L | $88,500 | Stewart Title | |
| Weidemiller Anita | $90,000 | -- |
Source: Public Records
Mortgage History
| Date | Status | Borrower | Loan Amount |
|---|---|---|---|
| Open | Jackson Dorothy J | $115,900 | |
| Previous Owner | Perkins Gwendolyn L | $85,845 |
Source: Public Records
Tax History
| Year | Tax Paid | Tax Assessment Tax Assessment Total Assessment is a certain percentage of the fair market value that is determined by local assessors to be the total taxable value of land and additions on the property. | Land | Improvement |
|---|---|---|---|---|
| 2025 | $246 | $13,552 | $1,460 | $12,092 |
| 2024 | $246 | $13,552 | $1,460 | $12,092 |
| 2023 | $247 | $13,000 | $1,168 | $11,832 |
| 2022 | $247 | $13,000 | $1,168 | $11,832 |
| 2021 | $236 | $12,999 | $1,167 | $11,832 |
| 2020 | $243 | $7,698 | $1,109 | $6,589 |
| 2019 | $242 | $8,435 | $1,109 | $7,326 |
| 2018 | $239 | $8,435 | $1,109 | $7,326 |
| 2017 | $255 | $8,078 | $992 | $7,086 |
| 2016 | $681 | $8,078 | $992 | $7,086 |
| 2015 | $654 | $8,078 | $992 | $7,086 |
| 2014 | $649 | $8,079 | $934 | $7,145 |
| 2013 | $651 | $8,079 | $934 | $7,145 |
Source: Public Records
Map
Nearby Homes
- 2548 W 118th St
- 2319 W 115th St
- 11412 S Oakley Ave
- 2521 120th St
- 2221 119th Place
- 11814 S Hale Ave
- 11419 S Fairfield Ave
- 11345 S Bell Ave
- 2010 W 115th St
- 11628 S Church St
- 11333 S Lothair Ave
- 2658 122nd St
- 2153 121st Place
- 12214 Maple Ave
- 12202 Irving Ave
- 11720 S Watkins Ave
- 2550 W 112th St Unit 12L
- 2550 W 112th St Unit D
- 11224 S Fairfield Ave
- 12248 Fairway Cir Unit B
- 2432 W 117th St Unit 24321
- 2434 W 117th St Unit 24342
- 2436 W 117th St Unit 24341
- 2436 W 117th St Unit 24322
- 2436 W 117th St Unit 24361
- 2436 W 117th St Unit 24362
- 2438 W 117th St Unit 24422
- 2438 W 117th St Unit 24381
- 2438 W 117th St Unit 24382
- 2438 W 117th St Unit 24402
- 2438 W 117th St Unit 24421
- 2440 W 117th St Unit 24401
- 2440 W 117th St Unit 2
- 2440 W 117th St Unit 1
- 11646 S Artesian Ave
- 11642 S Artesian Ave
- 11700 S Artesian Ave
- 11638 S Artesian Ave
- 11655 S Campbell Ave
Your Personal Tour Guide
Ask me questions while you tour the home.