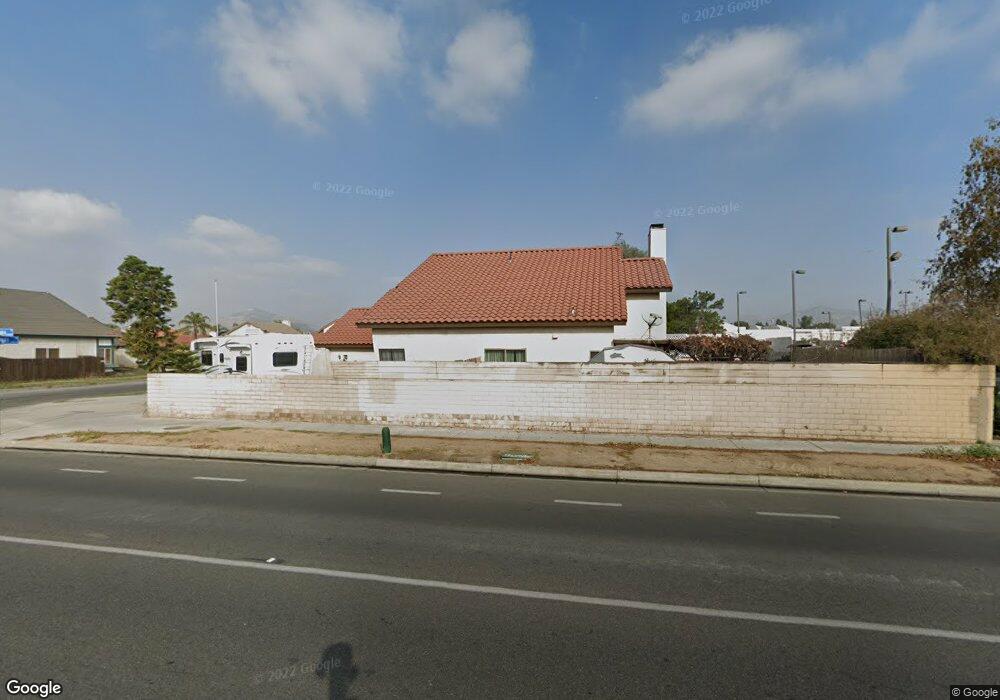
24372 Via Vargas Dr Moreno Valley, CA 92553
Ramona NeighborhoodEstimated Value: $542,839 - $578,000
4
Beds
2
Baths
1,931
Sq Ft
$293/Sq Ft
Est. Value
About This Home
This home is located at 24372 Via Vargas Dr, Moreno Valley, CA 92553 and is currently estimated at $565,960, approximately $293 per square foot. 24372 Via Vargas Dr is a home located in Riverside County with nearby schools including Ramona Elementary School, Badger Springs Middle School, and Moreno Valley High School.
Ownership History
Date
Name
Owned For
Owner Type
Purchase Details
Closed on
Jan 7, 1997
Sold by
Nunez David
Bought by
Nunez Christine
Current Estimated Value
Home Financials for this Owner
Home Financials are based on the most recent Mortgage that was taken out on this home.
Original Mortgage
$102,502
Outstanding Balance
$10,910
Interest Rate
7.53%
Mortgage Type
FHA
Estimated Equity
$555,050
Purchase Details
Closed on
Jan 6, 1997
Sold by
Federal Home Loan Mortgage Corporation
Bought by
Nunez Christine
Home Financials for this Owner
Home Financials are based on the most recent Mortgage that was taken out on this home.
Original Mortgage
$102,502
Outstanding Balance
$10,910
Interest Rate
7.53%
Mortgage Type
FHA
Estimated Equity
$555,050
Purchase Details
Closed on
Sep 19, 1996
Sold by
California Mtg Service
Bought by
Federal Home Loan Mortgage Corporation
Create a Home Valuation Report for This Property
The Home Valuation Report is an in-depth analysis detailing your home's value as well as a comparison with similar homes in the area
Home Values in the Area
Average Home Value in this Area
Purchase History
| Date | Buyer | Sale Price | Title Company |
|---|---|---|---|
| Nunez Christine | -- | Commonwealth Land Title Co | |
| Nunez Christine | $103,000 | Commonwealth Land Title Co | |
| Federal Home Loan Mortgage Corporation | -- | Benefit Land Title Ins Co | |
| California Mtg Service | $103,000 | Benefit Land Title Ins Co |
Source: Public Records
Mortgage History
| Date | Status | Borrower | Loan Amount |
|---|---|---|---|
| Open | Nunez Christine | $102,502 |
Source: Public Records
Tax History Compared to Growth
Tax History
| Year | Tax Paid | Tax Assessment Tax Assessment Total Assessment is a certain percentage of the fair market value that is determined by local assessors to be the total taxable value of land and additions on the property. | Land | Improvement |
|---|---|---|---|---|
| 2025 | $2,021 | $176,674 | $32,555 | $144,119 |
| 2023 | $2,021 | $169,816 | $31,292 | $138,524 |
| 2022 | $1,944 | $166,487 | $30,679 | $135,808 |
| 2021 | $1,907 | $163,224 | $30,078 | $133,146 |
| 2020 | $1,887 | $161,551 | $29,770 | $131,781 |
| 2019 | $1,856 | $158,385 | $29,187 | $129,198 |
| 2018 | $1,819 | $155,280 | $28,615 | $126,665 |
| 2017 | $1,780 | $152,236 | $28,054 | $124,182 |
| 2016 | $2,176 | $149,252 | $27,504 | $121,748 |
| 2015 | $1,852 | $147,012 | $27,092 | $119,920 |
| 2014 | $1,620 | $144,134 | $26,562 | $117,572 |
Source: Public Records
Map
Nearby Homes
- 13147 Indian St
- 13855 Calada Dr
- 13921 Pheasant Knoll Ln
- 24404 Bay Ave
- 14241 Stonehurst Dr
- 24331 Finley Dr
- 14175 Travers Dr
- 24315 Dolan Dr
- 24905 Gulfstream Ln
- 13599 Vellanto Way
- 24657 Merit Ct
- 24150 Rothbury Dr
- 0 Alessandro Blvd Unit NDP2105461
- 0 Alessandro Blvd Unit NDP2105462
- 0 Alessandro Blvd Unit SW25270413
- 0 Alessandro Blvd Unit SW21269055
- 24931 Heil Dr
- 24490 Janet Kay Dr
- 24884 Lorna Dr
- 24706 Mars Ct
- 24362 Via Vargas Dr
- 24331 Via Vargas Dr
- 24358 Via Vargas Dr
- 24348 Via Vargas Dr
- 14010 Brandt Dr
- 24321 Via Vargas Dr
- 24338 Via Vargas Dr
- 14024 Brandt Dr
- 24326 Via Vargas Dr
- 24311 Via Vargas Dr
- 24361 Bairndale Dr
- 24330 Mount Russell Dr
- 24373 Bairndale Dr
- 24347 Bairndale Dr
- 24316 Via Vargas Dr
- 14036 Brandt Dr
- 24316 Mount Russell Dr
- 24295 Via Vargas Dr
- 24335 Bairndale Dr
- 24298 Via Vargas Dr