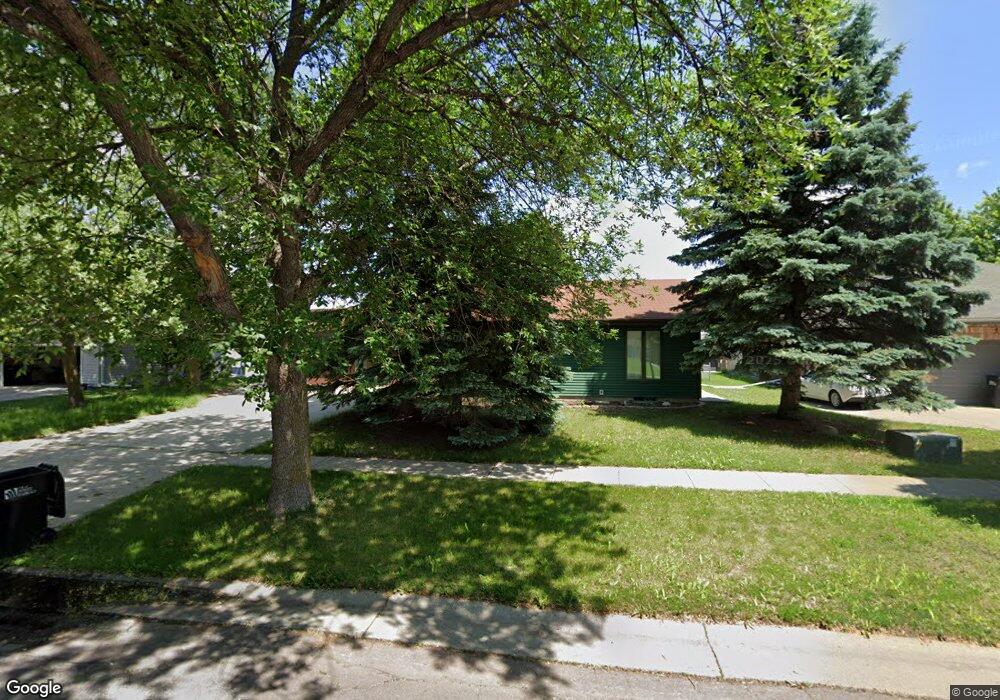
244 12th Ave E West Fargo, ND 58078
Eastwood NeighborhoodEstimated Value: $280,910 - $319,000
4
Beds
3
Baths
1,264
Sq Ft
$237/Sq Ft
Est. Value
About This Home
This home is located at 244 12th Ave E, West Fargo, ND 58078 and is currently estimated at $299,955, approximately $237 per square foot. 244 12th Ave E is a home located in Cass County with nearby schools including Eastwood Elementary School, Cheney Middle School, and West Fargo High School.
Ownership History
Date
Name
Owned For
Owner Type
Purchase Details
Closed on
Oct 21, 2020
Sold by
Johnston Dane C and Johnston Alexis
Bought by
Johnston Dane C and Johnston Alexis
Current Estimated Value
Home Financials for this Owner
Home Financials are based on the most recent Mortgage that was taken out on this home.
Original Mortgage
$173,300
Outstanding Balance
$153,860
Interest Rate
2.8%
Mortgage Type
New Conventional
Estimated Equity
$146,095
Purchase Details
Closed on
Jun 29, 2018
Sold by
Johnston Chris E
Bought by
Johnston Dane C
Home Financials for this Owner
Home Financials are based on the most recent Mortgage that was taken out on this home.
Original Mortgage
$175,750
Interest Rate
4.6%
Mortgage Type
New Conventional
Purchase Details
Closed on
Oct 25, 2008
Sold by
Griffeth Scott A
Bought by
Johnston Chris E
Home Financials for this Owner
Home Financials are based on the most recent Mortgage that was taken out on this home.
Original Mortgage
$149,190
Interest Rate
6.48%
Mortgage Type
FHA
Create a Home Valuation Report for This Property
The Home Valuation Report is an in-depth analysis detailing your home's value as well as a comparison with similar homes in the area
Home Values in the Area
Average Home Value in this Area
Purchase History
| Date | Buyer | Sale Price | Title Company |
|---|---|---|---|
| Johnston Dane C | -- | Fm Title | |
| Johnston Dane C | $185,000 | Title Co | |
| Johnston Chris E | -- | -- |
Source: Public Records
Mortgage History
| Date | Status | Borrower | Loan Amount |
|---|---|---|---|
| Open | Johnston Dane C | $173,300 | |
| Closed | Johnston Dane C | $175,750 | |
| Previous Owner | Johnston Chris E | $149,190 |
Source: Public Records
Tax History Compared to Growth
Tax History
| Year | Tax Paid | Tax Assessment Tax Assessment Total Assessment is a certain percentage of the fair market value that is determined by local assessors to be the total taxable value of land and additions on the property. | Land | Improvement |
|---|---|---|---|---|
| 2024 | $3,438 | $145,300 | $23,150 | $122,150 |
| 2023 | $3,872 | $142,150 | $23,150 | $119,000 |
| 2022 | $3,748 | $131,500 | $23,150 | $108,350 |
| 2021 | $3,437 | $116,700 | $16,850 | $99,850 |
| 2020 | $3,341 | $116,450 | $16,850 | $99,600 |
| 2019 | $3,462 | $108,750 | $16,850 | $91,900 |
| 2018 | $3,136 | $100,700 | $16,850 | $83,850 |
| 2017 | $3,028 | $97,500 | $16,850 | $80,650 |
| 2016 | $2,741 | $94,400 | $16,850 | $77,550 |
| 2015 | $2,787 | $88,000 | $13,200 | $74,800 |
| 2014 | $2,755 | $82,250 | $13,200 | $69,050 |
| 2013 | $2,706 | $78,350 | $13,200 | $65,150 |
Source: Public Records
Map
Nearby Homes
- 342 12th Ave E
- 342 12th Ave E Unit 21
- 342 12th Ave E Unit 21
- 302 12th Ave E
- 238 12th Ave E
- 243 11th Ave E
- 301 11th Ave E
- 237 11th Ave E
- 232 12th Ave E
- 1108 4th St E
- 312 12 1 2 Ave E
- 231 11th Ave E
- 1102 4th St E
- 303 12th Ave E
- 305 12th Ave E
- 332 12 1 2 Ave E
- 226 12th Ave E
- 321 12th Ave E
- 307 12th Ave E
- 225 11th Ave E