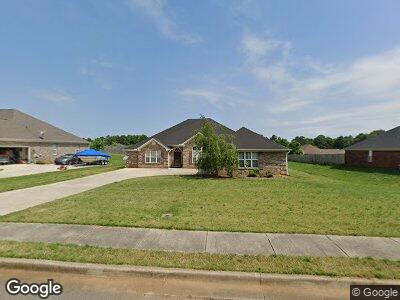
244 Latigo Loop Huntsville, AL 35806
Research Park NeighborhoodEstimated Value: $393,000 - $483,000
--
Bed
1
Bath
3,002
Sq Ft
$144/Sq Ft
Est. Value
About This Home
This home is located at 244 Latigo Loop, Huntsville, AL 35806 and is currently estimated at $432,509, approximately $144 per square foot. 244 Latigo Loop is a home with nearby schools including Monrovia Elementary School, Monrovia Middle School, and Sparkman High School.
Ownership History
Date
Name
Owned For
Owner Type
Purchase Details
Closed on
Aug 31, 2010
Sold by
Fuqua David L
Bought by
Childress Ronald G
Current Estimated Value
Home Financials for this Owner
Home Financials are based on the most recent Mortgage that was taken out on this home.
Original Mortgage
$253,549
Outstanding Balance
$172,278
Interest Rate
4.25%
Mortgage Type
FHA
Estimated Equity
$250,159
Purchase Details
Closed on
Jun 7, 2006
Sold by
Turney Hannah and Zapata Hannah
Bought by
Fuqua David L
Home Financials for this Owner
Home Financials are based on the most recent Mortgage that was taken out on this home.
Original Mortgage
$210,400
Interest Rate
6.5%
Mortgage Type
New Conventional
Purchase Details
Closed on
May 16, 2005
Sold by
Dennis Olive Homes Inc
Bought by
Turney Hannah
Home Financials for this Owner
Home Financials are based on the most recent Mortgage that was taken out on this home.
Original Mortgage
$190,720
Interest Rate
8.25%
Mortgage Type
Adjustable Rate Mortgage/ARM
Create a Home Valuation Report for This Property
The Home Valuation Report is an in-depth analysis detailing your home's value as well as a comparison with similar homes in the area
Home Values in the Area
Average Home Value in this Area
Purchase History
| Date | Buyer | Sale Price | Title Company |
|---|---|---|---|
| Childress Ronald G | -- | -- | |
| Fuqua David L | -- | -- | |
| Turney Hannah | -- | -- |
Source: Public Records
Mortgage History
| Date | Status | Borrower | Loan Amount |
|---|---|---|---|
| Open | Childress Ronald G | $253,549 | |
| Previous Owner | Fuqua David L | $210,400 | |
| Previous Owner | Fuqua David L | $39,450 | |
| Previous Owner | Turney Hannah | $190,720 | |
| Previous Owner | Turney Hannah | $47,680 |
Source: Public Records
Tax History Compared to Growth
Tax History
| Year | Tax Paid | Tax Assessment Tax Assessment Total Assessment is a certain percentage of the fair market value that is determined by local assessors to be the total taxable value of land and additions on the property. | Land | Improvement |
|---|---|---|---|---|
| 2024 | $1,239 | $35,740 | $6,000 | $29,740 |
| 2023 | $1,239 | $34,680 | $6,000 | $28,680 |
| 2022 | $970 | $28,120 | $2,780 | $25,340 |
| 2021 | $905 | $26,340 | $2,780 | $23,560 |
| 2020 | $847 | $24,750 | $2,780 | $21,970 |
| 2019 | $811 | $23,760 | $2,780 | $20,980 |
| 2018 | $747 | $22,000 | $0 | $0 |
| 2017 | $747 | $22,000 | $0 | $0 |
| 2016 | $747 | $22,000 | $0 | $0 |
| 2015 | $747 | $22,000 | $0 | $0 |
| 2014 | $791 | $23,220 | $0 | $0 |
Source: Public Records
Map
Nearby Homes
- 103 Sherwin Ave
- 1033 Scarlet Woods
- 1010 Scarlet Woods
- 1045 Split Rock Cove
- 133 Raccoon Trace
- 117 Kretzer Ct
- 1006 Split Rock Cove NW
- 112 Vaughnwood Trace
- 246 Bishop Farm Way NW
- 242 Bishop Farm Way NW
- 310 Natchez Trail
- 7913 Gabriela Dr NW
- 789 Plummer Rd
- 8307 Stillwater Cir NW
- 8209 Stone Mill Dr NW
- 103 Nobleton Ln NW
- 105 Turtle Bank Ct
- 7608 Ashor Dr NW
- 130 Kingswood Dr
- 7607 Ashor Dr NW
- 244 Latigo Loop
- 246 Latigo Loop
- 242 Latigo Loop
- 248 Latigo Loop
- 245 Latigo Loop
- 243 Latigo Loop
- 236 Latigo Loop
- 247 Latigo Loop
- 241 Latigo Loop
- 230 Latigo Loop
- 260 Latigo Loop
- 254 Latigo Loop
- 249 Latigo Loop
- 228 Latigo Loop
- 239 Latigo Loop
- 262 Latigo Loop
- 233 Latigo Loop
- 251 Latigo Loop
- 231 Latigo Loop
- 837 Dan Tibbs Rd NW