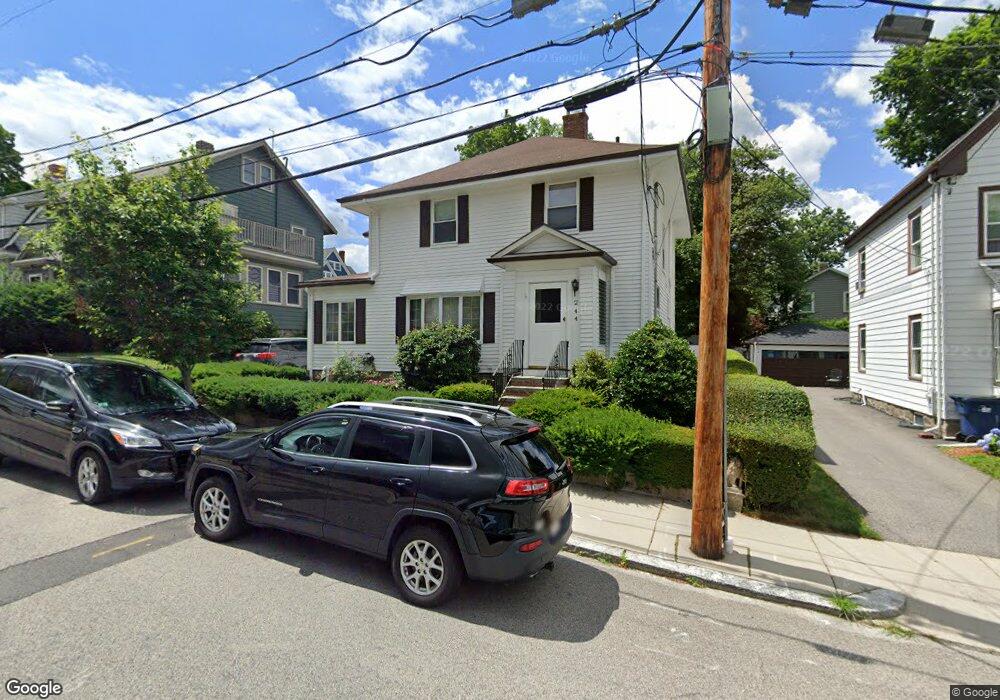
244 Manthorne Rd West Roxbury, MA 02132
West Roxbury NeighborhoodEstimated Value: $878,342 - $953,000
3
Beds
3
Baths
1,731
Sq Ft
$532/Sq Ft
Est. Value
About This Home
This home is located at 244 Manthorne Rd, West Roxbury, MA 02132 and is currently estimated at $920,586, approximately $531 per square foot. 244 Manthorne Rd is a home located in Suffolk County with nearby schools including Holy Name Parish School, St Theresa School, and Catholic Memorial School.
Ownership History
Date
Name
Owned For
Owner Type
Purchase Details
Closed on
Oct 11, 2023
Sold by
Dimarino Verlinda C and Dimarino Stephen M
Bought by
Cotton Dimarino Ft and Dimarino
Current Estimated Value
Purchase Details
Closed on
Nov 10, 2011
Sold by
Dimarino Verlinda C
Bought by
Dimarino Stephen M and Dimarino Verlinda C
Home Financials for this Owner
Home Financials are based on the most recent Mortgage that was taken out on this home.
Original Mortgage
$146,000
Interest Rate
4.01%
Mortgage Type
Purchase Money Mortgage
Purchase Details
Closed on
Jun 3, 1996
Sold by
Shin Yong T
Bought by
Dimarino Verlinda C and Dimarino Stephen M
Purchase Details
Closed on
Oct 12, 1995
Sold by
Ralph Deborah J and Shin Yong T
Bought by
Shin Yong T
Purchase Details
Closed on
Aug 31, 1994
Sold by
Ward Regina M
Bought by
Ralph Deborah J and Shin Yong T
Create a Home Valuation Report for This Property
The Home Valuation Report is an in-depth analysis detailing your home's value as well as a comparison with similar homes in the area
Home Values in the Area
Average Home Value in this Area
Purchase History
| Date | Buyer | Sale Price | Title Company |
|---|---|---|---|
| Cotton Dimarino Ft | -- | None Available | |
| Dimarino Stephen M | -- | -- | |
| Dimarino Verlinda C | $176,000 | -- | |
| Shin Yong T | $15,000 | -- | |
| Ralph Deborah J | $160,000 | -- |
Source: Public Records
Mortgage History
| Date | Status | Borrower | Loan Amount |
|---|---|---|---|
| Previous Owner | Ralph Deborah J | $316,000 | |
| Previous Owner | Dimarino Stephen M | $146,000 | |
| Previous Owner | Ralph Deborah J | $30,000 |
Source: Public Records
Tax History Compared to Growth
Tax History
| Year | Tax Paid | Tax Assessment Tax Assessment Total Assessment is a certain percentage of the fair market value that is determined by local assessors to be the total taxable value of land and additions on the property. | Land | Improvement |
|---|---|---|---|---|
| 2025 | $9,207 | $795,100 | $229,300 | $565,800 |
| 2024 | $7,905 | $725,200 | $230,000 | $495,200 |
| 2023 | $7,253 | $675,300 | $216,900 | $458,400 |
| 2022 | $6,516 | $598,900 | $197,200 | $401,700 |
| 2021 | $6,086 | $570,400 | $189,600 | $380,800 |
| 2020 | $5,596 | $529,900 | $171,700 | $358,200 |
| 2019 | $5,218 | $495,100 | $144,600 | $350,500 |
| 2018 | $4,991 | $476,200 | $144,600 | $331,600 |
| 2017 | $4,991 | $471,300 | $144,600 | $326,700 |
| 2016 | $4,846 | $440,500 | $144,600 | $295,900 |
| 2015 | $5,091 | $420,400 | $159,800 | $260,600 |
| 2014 | $4,601 | $365,700 | $159,800 | $205,900 |
Source: Public Records
Map
Nearby Homes
- 168 Maple St
- 701 Vfw Pkwy
- 19 Pomfret St
- 37 Pomfret St
- 10 Burwell Rd
- 55 Redlands Rd
- 76 Vermont St
- 173 South St
- 1789 Centre St Unit 202
- 72 Wallis Rd
- 37 Hastings St Unit 103
- 143 South St
- 170 Payson Rd
- 50-56 Broadlawn Park Unit 221
- 23 Westgate Rd Unit 6
- 21 Westgate Rd Unit 6
- 42 Bryon Rd Unit 6
- 865 Lagrange St Unit 5
- 110 Park St Unit 3
- 139 Newfield St
- 248 Manthorne Rd
- 75 Garnet Rd
- 236 Manthorne Rd
- 252 Manthorne Rd
- 79 Garnet Rd
- 71 Garnet Rd
- 83 Garnet Rd
- 67 Garnet Rd
- 243 Manthorne Rd
- 232 Manthorne Rd
- 256 Manthorne Rd
- 239 Manthorne Rd
- 87 Garnet Rd
- 63 Garnet Rd
- 540 Veterans of Foreign Wars Pkwy
- 530 Vfw Pkwy
- 530 Vfw Pkwy Unit 205
- 530 Vfw Pkwy Unit 105
- 530 Vfw Pkwy Unit 104
- 530 Vfw Pkwy Unit 204