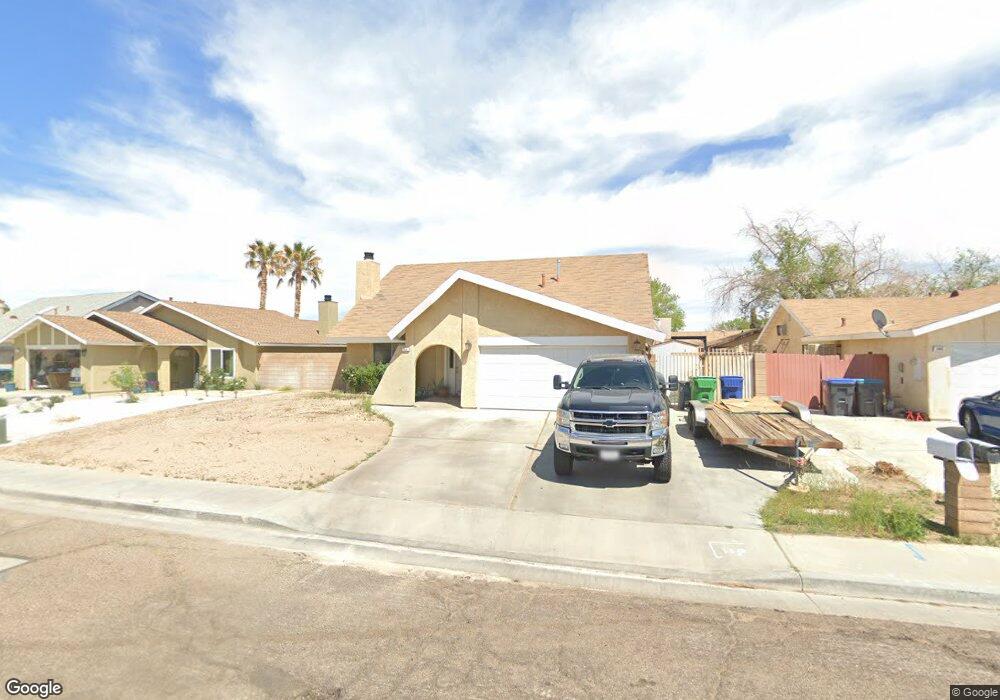
244 N Broadway St Ridgecrest, CA 93555
Estimated Value: $282,000 - $321,000
3
Beds
2
Baths
1,012
Sq Ft
$292/Sq Ft
Est. Value
About This Home
This home is located at 244 N Broadway St, Ridgecrest, CA 93555 and is currently estimated at $295,141, approximately $291 per square foot. 244 N Broadway St is a home located in Kern County with nearby schools including Pierce Elementary School, Murray Middle School, and Burroughs High School.
Ownership History
Date
Name
Owned For
Owner Type
Purchase Details
Closed on
Nov 30, 2016
Sold by
Santiago Jose E
Bought by
Santiago Mario
Current Estimated Value
Home Financials for this Owner
Home Financials are based on the most recent Mortgage that was taken out on this home.
Original Mortgage
$152,318
Outstanding Balance
$74,741
Interest Rate
4.03%
Mortgage Type
New Conventional
Estimated Equity
$220,400
Purchase Details
Closed on
Sep 9, 2016
Sold by
Santiago Candice Nichole
Bought by
Santiago Mario
Purchase Details
Closed on
Sep 25, 2001
Sold by
Cheadle Gary Lee and Cheadle Nancy Ann
Bought by
Santiago Jose E
Home Financials for this Owner
Home Financials are based on the most recent Mortgage that was taken out on this home.
Original Mortgage
$89,203
Interest Rate
6.91%
Mortgage Type
FHA
Create a Home Valuation Report for This Property
The Home Valuation Report is an in-depth analysis detailing your home's value as well as a comparison with similar homes in the area
Home Values in the Area
Average Home Value in this Area
Purchase History
| Date | Buyer | Sale Price | Title Company |
|---|---|---|---|
| Santiago Mario | $169,500 | Placer Title Company | |
| Santiago Mario | -- | Placer Title Company | |
| Santiago Jose E | $90,000 | First American Title Co |
Source: Public Records
Mortgage History
| Date | Status | Borrower | Loan Amount |
|---|---|---|---|
| Open | Santiago Mario | $152,318 | |
| Closed | Santiago Jose E | $89,203 |
Source: Public Records
Tax History Compared to Growth
Tax History
| Year | Tax Paid | Tax Assessment Tax Assessment Total Assessment is a certain percentage of the fair market value that is determined by local assessors to be the total taxable value of land and additions on the property. | Land | Improvement |
|---|---|---|---|---|
| 2025 | $2,677 | $196,365 | $23,209 | $173,156 |
| 2024 | $2,600 | $192,515 | $22,754 | $169,761 |
| 2023 | $2,600 | $188,741 | $22,308 | $166,433 |
| 2022 | $2,548 | $185,041 | $21,871 | $163,170 |
| 2021 | $2,473 | $181,414 | $21,443 | $159,971 |
| 2020 | $2,416 | $179,555 | $21,224 | $158,331 |
| 2019 | $2,377 | $179,555 | $21,224 | $158,331 |
| 2018 | $2,334 | $172,584 | $20,400 | $152,184 |
| 2017 | $1,979 | $137,628 | $19,086 | $118,542 |
| 2016 | $1,904 | $134,931 | $18,712 | $116,219 |
| 2015 | $1,876 | $132,906 | $18,431 | $114,475 |
| 2014 | $1,735 | $130,304 | $18,070 | $112,234 |
Source: Public Records
Map
Nearby Homes
- 729 N Sunland Dr Unit H
- 142 Chambers St Unit K
- 124 Jacquelyn Ct
- 134 N American St
- 625 Cottonwood Dr
- 632-A Commercial
- 1 E Ridgecrest Blvd
- 525 E Ridgecrest Blvd Unit 11
- 0 S Gateway Blvd
- 2005 S American St
- 504 Commercial Ave Unit A
- 317 N Gold Canyon St
- 217 S American St
- 112 Valley St
- 205 Rancho St
- 228 S Greenlawn St
- 132 S Holly Canyon Dr
- 304 Palm Dr Unit G
- 645 E Church Ave
- 218 S Sunland St
- 248 N Broadway St
- 240 N Broadway St
- 240 N Broadway St
- 241 Chambers St
- 237 Chambers St
- 252 N Broadway St
- 236 N Broadway St
- 245 Chambers St Unit H
- 233 Chambers St
- 236 Kimberly Ln
- 247 Kimberly Ln
- 256 N Broadway St
- 249 Chambers St Unit H
- 229 Chambers St
- 243 Kimberly Ln
- 221 N American St
- 634 N Sunland Dr
- 232 Kimberly Ln
- 236 Chambers St Unit H
- 232 Chambers St