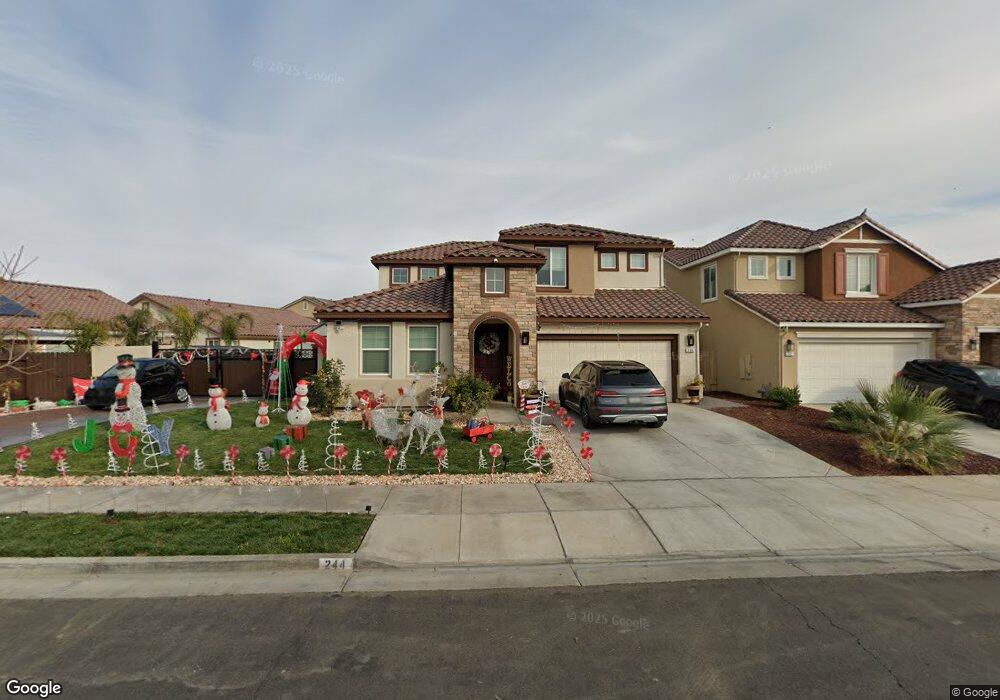
244 San Lorenzo St Los Banos, CA 93635
Estimated Value: $569,000 - $636,000
5
Beds
4
Baths
2,783
Sq Ft
$220/Sq Ft
Est. Value
About This Home
This home is located at 244 San Lorenzo St, Los Banos, CA 93635 and is currently estimated at $613,511, approximately $220 per square foot. 244 San Lorenzo St is a home located in Merced County with nearby schools including Grasslands Elementary School, Los Banos Junior High School, and Pacheco High School.
Ownership History
Date
Name
Owned For
Owner Type
Purchase Details
Closed on
May 7, 2019
Sold by
Stonefield Home Inc
Bought by
Gracia Joel
Current Estimated Value
Home Financials for this Owner
Home Financials are based on the most recent Mortgage that was taken out on this home.
Original Mortgage
$346,552
Outstanding Balance
$304,070
Interest Rate
4.1%
Mortgage Type
New Conventional
Estimated Equity
$309,441
Purchase Details
Closed on
May 24, 2017
Sold by
Trevino Pioneer Llc
Bought by
Stonefield Home Inc
Purchase Details
Closed on
Mar 25, 2015
Sold by
A & H Investments Llc
Bought by
Trevino Pioneer Llc
Purchase Details
Closed on
Jun 16, 2011
Sold by
Florsheim Land Company Llc
Bought by
A & H Investments
Purchase Details
Closed on
Jun 12, 2011
Sold by
Woodside 05N Lp
Bought by
Florsheim Land Company Llc
Create a Home Valuation Report for This Property
The Home Valuation Report is an in-depth analysis detailing your home's value as well as a comparison with similar homes in the area
Home Values in the Area
Average Home Value in this Area
Purchase History
| Date | Buyer | Sale Price | Title Company |
|---|---|---|---|
| Gracia Joel | $433,500 | Fidelity National Title Co | |
| Gracia Joel | -- | Fidelity National Title Co | |
| Stonefield Home Inc | $4,700,000 | Fidelity National Title | |
| Trevino Pioneer Llc | -- | Accommodation | |
| A & H Investments | -- | Fidelity National Title Comp | |
| Florsheim Land Company Llc | -- | Old Republic Title Company |
Source: Public Records
Mortgage History
| Date | Status | Borrower | Loan Amount |
|---|---|---|---|
| Open | Gracia Joel | $346,552 |
Source: Public Records
Tax History Compared to Growth
Tax History
| Year | Tax Paid | Tax Assessment Tax Assessment Total Assessment is a certain percentage of the fair market value that is determined by local assessors to be the total taxable value of land and additions on the property. | Land | Improvement |
|---|---|---|---|---|
| 2025 | $6,839 | $552,344 | $94,816 | $457,528 |
| 2024 | $6,839 | $541,514 | $92,957 | $448,557 |
| 2023 | $6,471 | $530,897 | $91,135 | $439,762 |
| 2022 | $5,652 | $455,489 | $89,349 | $366,140 |
| 2021 | $5,579 | $446,559 | $87,598 | $358,961 |
| 2020 | $5,511 | $441,981 | $86,700 | $355,281 |
| 2019 | $5,410 | $434,035 | $94,035 | $340,000 |
| 2018 | $1,611 | $92,192 | $92,192 | $0 |
| 2017 | $802 | $51,777 | $51,777 | $0 |
| 2016 | $797 | $50,762 | $50,762 | $0 |
| 2015 | $359 | $13,110 | $13,110 | $0 |
| 2014 | $355 | $12,854 | $12,854 | $0 |
Source: Public Records
Map
Nearby Homes
- 1453 Willmott Rd
- 256 San Pelmo Ct
- 1351 E B St
- 17490 Mercey Springs Rd
- 343 San Bernardino St
- 1447 Nottingham Cir
- 1236 Santa Cruz Way
- 1416 San Rafael St
- 2080 Constantine Ct
- 418 Rockport Dr
- 1505 Sarba Ct
- 1501 Sarba Ct
- The Stella Plan at Southpointe
- The Argent Plan at Southpointe
- The Fasano Plan at Southpointe
- The Monterey Plan at Southpointe
- The Caledonia Plan at Southpointe
- The Santa Cruz Plan at Southpointe
- The Florencia Plan at Southpointe
- The Ashington Plan at Southpointe
- 244 San Lorenzo St
- 356 San Lorenzo St
- 242 San Lorenzo St
- 1411 Willmott Rd
- 1413 Willmott Rd
- 1416 San Pedro St
- 1417 Willmott Rd
- 245 San Lorenzo St
- 1420 San Pedro St
- 243 San Lorenzo St
- 247 San Lorenzo St
- 1421 Willmott Rd
- 238 San Lorenzo St
- 241 San Lorenzo St
- 249 San Lorenzo St
- 1424 San Pedro St
- 1414 Willmott Rd
- 239 San Lorenzo St
- 252 San Lorenzo St
- 1419 San Pedro St