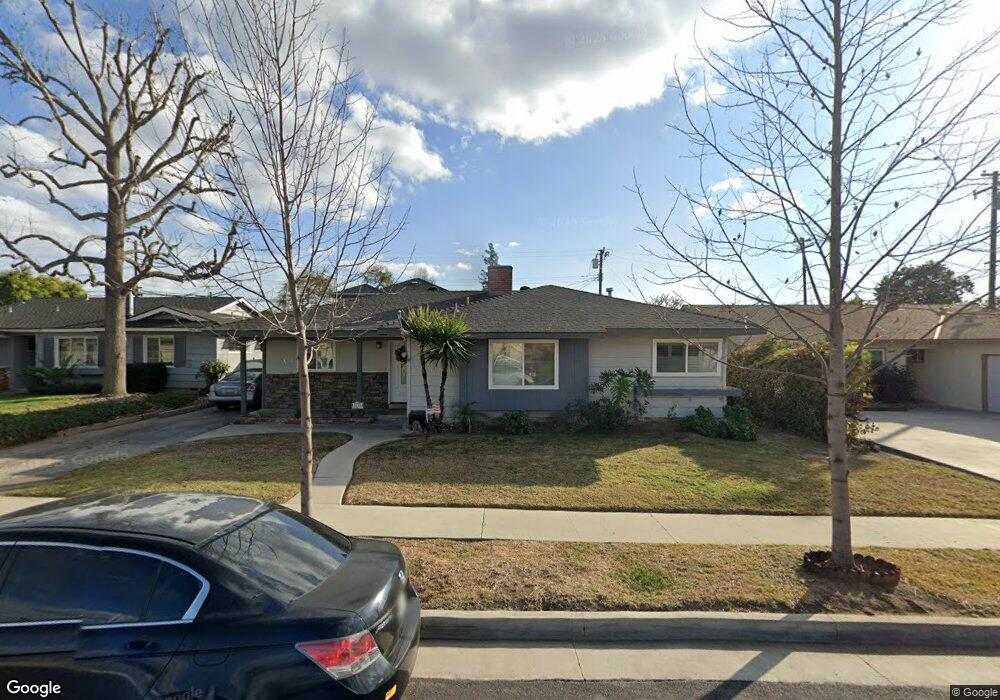
2440 Foxdale Ave La Habra, CA 90631
Estimated Value: $885,000 - $993,000
3
Beds
2
Baths
1,686
Sq Ft
$561/Sq Ft
Est. Value
About This Home
This home is located at 2440 Foxdale Ave, La Habra, CA 90631 and is currently estimated at $946,078, approximately $561 per square foot. 2440 Foxdale Ave is a home located in Orange County with nearby schools including Jordan Elementary School, Rancho-Starbuck Intermediate School, and La Habra High School.
Ownership History
Date
Name
Owned For
Owner Type
Purchase Details
Closed on
Jul 16, 2012
Sold by
Borough Phillip D and Borough Maricela
Bought by
Borough Phillip D and Borough Maricela
Current Estimated Value
Home Financials for this Owner
Home Financials are based on the most recent Mortgage that was taken out on this home.
Original Mortgage
$325,101
Outstanding Balance
$225,261
Interest Rate
3.75%
Mortgage Type
FHA
Estimated Equity
$720,817
Purchase Details
Closed on
Sep 9, 1997
Sold by
Mellon Properties Company
Bought by
Borough Phillip and Borough Maricela
Home Financials for this Owner
Home Financials are based on the most recent Mortgage that was taken out on this home.
Original Mortgage
$152,950
Interest Rate
7.54%
Purchase Details
Closed on
Jun 2, 1997
Sold by
Mellon Mtg Company
Bought by
Mellon Properties Company
Purchase Details
Closed on
Mar 14, 1997
Sold by
Ramos Sylvia L and Ramos Joseph R
Bought by
Mellon Mtg Company
Create a Home Valuation Report for This Property
The Home Valuation Report is an in-depth analysis detailing your home's value as well as a comparison with similar homes in the area
Home Values in the Area
Average Home Value in this Area
Purchase History
| Date | Buyer | Sale Price | Title Company |
|---|---|---|---|
| Borough Phillip D | -- | Lsi | |
| Borough Phillip | $161,000 | American Title Co | |
| Mellon Properties Company | $148,500 | Benefit Land Title Ins Compa | |
| Mellon Mtg Company | $148,544 | Fidelity National Title Ins |
Source: Public Records
Mortgage History
| Date | Status | Borrower | Loan Amount |
|---|---|---|---|
| Open | Borough Phillip D | $325,101 | |
| Closed | Borough Phillip | $152,950 |
Source: Public Records
Tax History Compared to Growth
Tax History
| Year | Tax Paid | Tax Assessment Tax Assessment Total Assessment is a certain percentage of the fair market value that is determined by local assessors to be the total taxable value of land and additions on the property. | Land | Improvement |
|---|---|---|---|---|
| 2025 | $4,292 | $401,199 | $149,370 | $251,829 |
| 2024 | $4,292 | $363,500 | $146,441 | $217,059 |
| 2023 | $3,020 | $247,084 | $143,570 | $103,514 |
| 2022 | $2,986 | $242,240 | $140,755 | $101,485 |
| 2021 | $2,929 | $237,491 | $137,995 | $99,496 |
| 2020 | $2,922 | $235,056 | $136,580 | $98,476 |
| 2019 | $2,858 | $230,448 | $133,902 | $96,546 |
| 2018 | $2,751 | $225,930 | $131,277 | $94,653 |
| 2017 | $2,704 | $221,500 | $128,702 | $92,798 |
| 2016 | $2,649 | $217,157 | $126,178 | $90,979 |
| 2015 | $2,578 | $213,896 | $124,283 | $89,613 |
| 2014 | $2,501 | $209,707 | $121,849 | $87,858 |
Source: Public Records
Map
Nearby Homes
- 2611 Gregory Ln
- 16540 Whittier Blvd
- 2100 Gregory Ln
- 9331 Mikinda Ave
- 2311 Canfield Dr
- 2401 Canfield Dr
- 10303 Pounds Ave
- 16621 Crape Myrtle Ln
- 9422 Canfield Dr
- 240 Oakland Dr
- 10418 Bogardus Ave
- 2641 Stanton Ave
- 9915 Corella Ave
- 16875 Sausalito Dr
- 16164 Leffco Rd
- 401 Granada Dr
- 16635 Monte Oro Dr
- 16121 Lisco St
- 10931 Groveside Ave
- 10930 Groveland Ave
- 2450 Foxdale Ave
- 2431 W Galen Dr
- 2420 Foxdale Ave
- 721 N Galen Dr
- 2421 W Galen Dr
- 750 Kinley St
- 740 Kinley St
- 2441 Foxdale Ave
- 2451 Foxdale Ave
- 2431 Foxdale Ave
- 730 Kinley St
- 2410 Foxdale Ave
- 2411 W Galen Dr
- 2461 Foxdale Ave
- 2421 Foxdale Ave
- 720 Kinley St
- 711 N Galen Dr
- 2471 Foxdale Ave
- 2400 Foxdale Ave
- 2411 Foxdale Ave