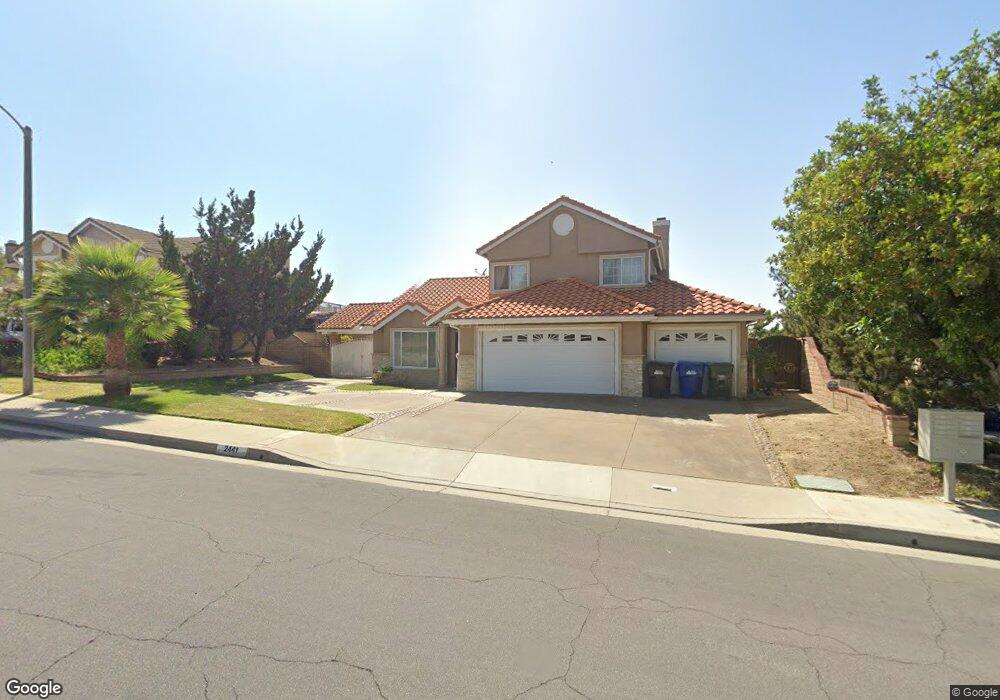
2441 Coraview Ln Rowland Heights, CA 91748
Estimated Value: $1,417,000 - $1,602,000
4
Beds
4
Baths
2,897
Sq Ft
$519/Sq Ft
Est. Value
About This Home
This home is located at 2441 Coraview Ln, Rowland Heights, CA 91748 and is currently estimated at $1,503,240, approximately $518 per square foot. 2441 Coraview Ln is a home located in Los Angeles County with nearby schools including Shelyn Elementary School, Alvarado Intermediate School, and John A. Rowland High School.
Ownership History
Date
Name
Owned For
Owner Type
Purchase Details
Closed on
Jul 3, 2023
Sold by
Mohrekesh Hassan
Bought by
Ozzie Mohrekesh Trust and Mohrekesh
Current Estimated Value
Purchase Details
Closed on
Feb 11, 2022
Sold by
Alex Abadi Trust
Bought by
Mohrekesh Hassan
Purchase Details
Closed on
Jun 6, 2005
Sold by
Abadi Alex and Hajakbari Alireza
Bought by
Abadi Alex and The Alex Abadi Trust
Purchase Details
Closed on
Feb 2, 1999
Sold by
Firmalino Pierre F and The Pierre & Mila Firmalino Li
Bought by
Hajakbari Alireza
Home Financials for this Owner
Home Financials are based on the most recent Mortgage that was taken out on this home.
Original Mortgage
$276,000
Interest Rate
6.7%
Mortgage Type
Stand Alone First
Purchase Details
Closed on
Sep 29, 1997
Sold by
Firmalino Pierre F and Firmalino Milagros C
Bought by
Firmalino Pierre F and Firmalino Mila Castaneda
Create a Home Valuation Report for This Property
The Home Valuation Report is an in-depth analysis detailing your home's value as well as a comparison with similar homes in the area
Home Values in the Area
Average Home Value in this Area
Purchase History
| Date | Buyer | Sale Price | Title Company |
|---|---|---|---|
| Ozzie Mohrekesh Trust | -- | None Listed On Document | |
| Mohrekesh Hassan | -- | None Listed On Document | |
| Abadi Alex | -- | None Available | |
| Hajakbari Alireza | $345,000 | Lawyers Title Company | |
| Firmalino Pierre F | -- | -- |
Source: Public Records
Mortgage History
| Date | Status | Borrower | Loan Amount |
|---|---|---|---|
| Previous Owner | Hajakbari Alireza | $276,000 |
Source: Public Records
Tax History Compared to Growth
Tax History
| Year | Tax Paid | Tax Assessment Tax Assessment Total Assessment is a certain percentage of the fair market value that is determined by local assessors to be the total taxable value of land and additions on the property. | Land | Improvement |
|---|---|---|---|---|
| 2025 | $15,466 | $1,267,081 | $822,436 | $444,645 |
| 2024 | $15,466 | $1,242,237 | $806,310 | $435,927 |
| 2023 | $14,935 | $1,217,880 | $790,500 | $427,380 |
| 2022 | $8,258 | $644,053 | $232,960 | $411,093 |
| 2021 | $8,117 | $631,426 | $228,393 | $403,033 |
| 2019 | $7,875 | $612,700 | $221,620 | $391,080 |
| 2018 | $7,493 | $600,687 | $217,275 | $383,412 |
| 2016 | $7,199 | $577,364 | $208,839 | $368,525 |
| 2015 | $7,081 | $568,693 | $205,703 | $362,990 |
| 2014 | $7,067 | $557,554 | $201,674 | $355,880 |
Source: Public Records
Map
Nearby Homes
- 2402 Pepperdale Dr
- 2350 Robert Rd
- 2366 Pepperdale Dr
- 19519 Greenwillow Ln
- 2189 Wind River Ln
- 2251 Cascade Way
- 2147 Wind River Ln
- 2360 Oakleaf Canyon Rd
- 2124 Camwood Ave
- 1919 Brea Canyon Cut-Off Rd
- 2545 Brea Canyon Cut Off Rd
- 1943 Arcdale Ave
- 20374 Bickford Dr
- 2446 Hillman Ln
- 19173 Hastings St
- 1953 Camwood Ave
- 20374 Portside Dr
- 20456 Holcroft Dr
- 1703 Hollandale Ave
- 20454 Sartell Dr
- 2449 Coraview Ln
- 2435 Coraview Ln
- 2410 Pepperdale Dr
- 2431 Coraview Ln
- 2459 Coraview Ln
- 2398 Pepperdale Dr
- 2436 Coraview Ln
- 2444 Coraview Ln
- 2427 Coraview Ln
- 2418 Pepperdale Dr
- 2452 Coraview Ln
- 2390 Pepperdale Dr
- 2471 Coraview Ln
- 2460 Coraview Ln
- 2416 Coraview Ln
- 19618 Charline Place
- 2419 Coraview Ln
- 19624 Charline Place
- 19608 Charline Place
- 2428 Pepperdale Dr